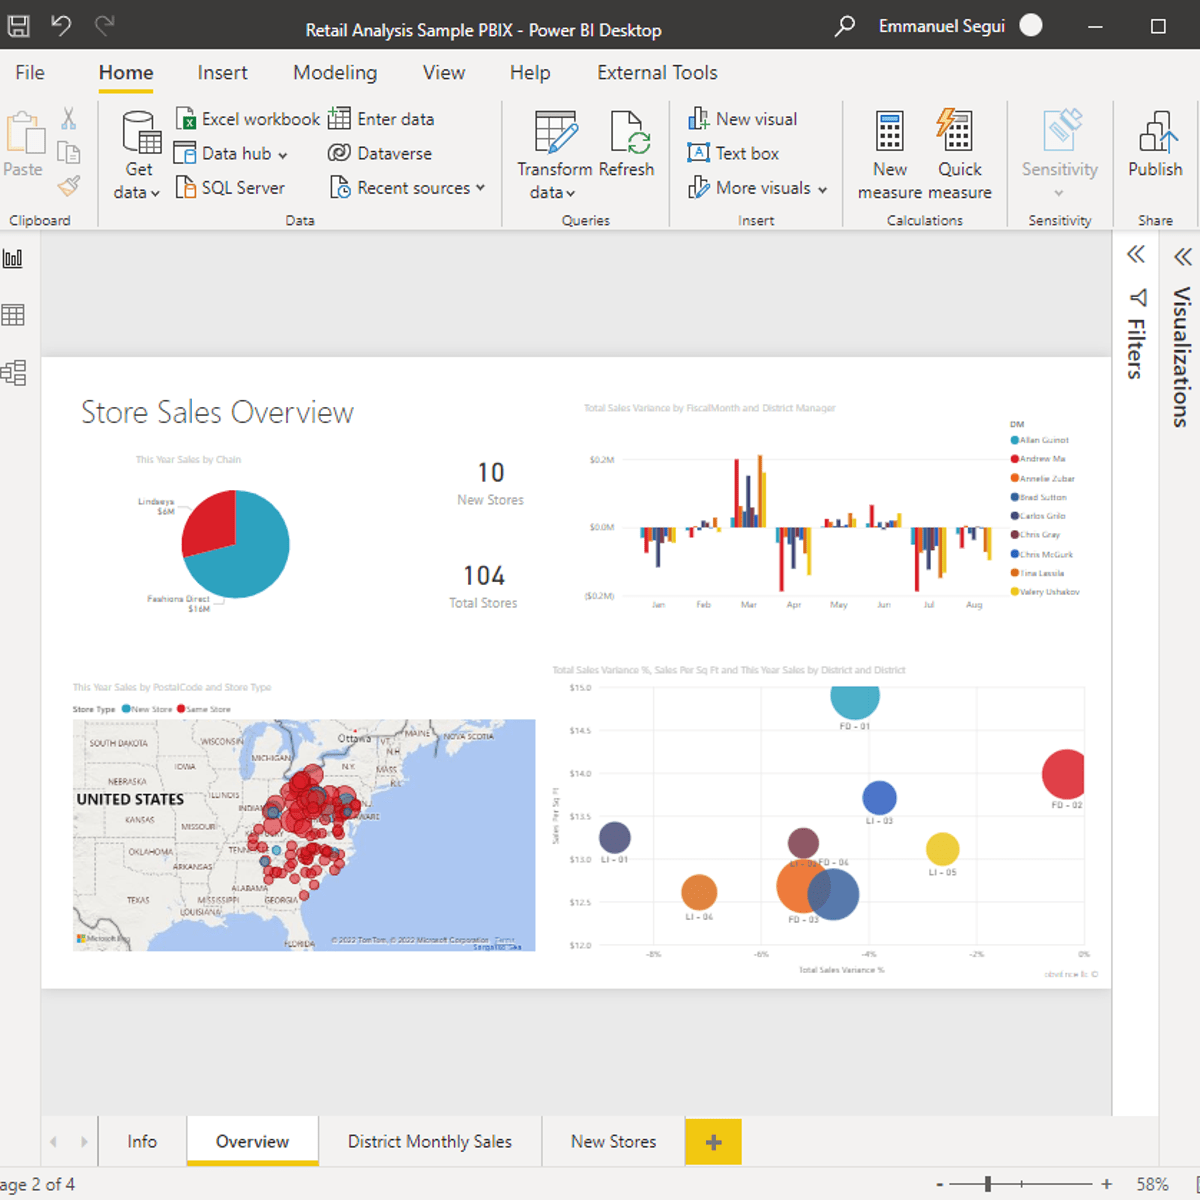
Connect Power BI to different sources to create interactive dashboards in Power BI. For example, a data analyst can build a dashboard that is interactive and can track key business metrics to help business stakeholders make actionable business decisions.
What's inside
Syllabus
Good to know
Save this course
Activities
Walkthrough of Power BI Dashboards
Show steps
Gain practical experience with Power BI dashboard creation by following guided tutorials.
Browse courses on
Dashboard Design
Show steps
-
Find and follow online tutorials on Power BI dashboard design.
-
Complete practice exercises to reinforce your understanding.
Hands-on Practice with Power BI Visuals
Show steps
Strengthen your skills in creating and customizing different types of visuals in Power BI.
Show steps
-
Explore various visual types available in Power BI.
-
Practice creating and customizing visuals using real-world data.
-
Experiment with different visualization techniques to convey data effectively.
Dashboard Design Project
Show steps
Create a prototype of a dashboard based on a real-world business scenario.
Show steps
-
Ideate and sketch out your dashboard design.
-
Identify key metrics and data sources.
-
Use Power BI to connect to data sources and create visuals.
-
Arrange visuals on a dashboard and customize visualizations.
-
Publish your dashboard and share it with stakeholders.
Two other activities
Expand to see all activities and additional details
Show all five activities
Dashboard Design Case Study
Show steps
Solidify your understanding by creating a detailed case study of a well-designed dashboard.
Browse courses on
Dashboard Design
Show steps
-
Identify a real-world business scenario and design a dashboard to address it.
-
Gather data and create visuals to support your design.
-
Write a comprehensive case study that documents your design process and results.
Power BI Dashboard Design Competition
Show steps
Challenging yourself in a competition helps to push your limits and fine-tune your skills in dashboard design.
Browse courses on
Dashboard Design
Show steps
-
Find and participate in Power BI dashboard design competitions.
-
Create and submit a dashboard that meets the competition requirements.
-
Analyze feedback and identify areas for improvement.
Walkthrough of Power BI Dashboards
Show steps
Gain practical experience with Power BI dashboard creation by following guided tutorials.
Browse courses on
Dashboard Design
Show steps
- Find and follow online tutorials on Power BI dashboard design.
- Complete practice exercises to reinforce your understanding.
Hands-on Practice with Power BI Visuals
Show steps
Strengthen your skills in creating and customizing different types of visuals in Power BI.
Show steps
- Explore various visual types available in Power BI.
- Practice creating and customizing visuals using real-world data.
- Experiment with different visualization techniques to convey data effectively.
Dashboard Design Project
Show steps
Create a prototype of a dashboard based on a real-world business scenario.
Show steps
- Ideate and sketch out your dashboard design.
- Identify key metrics and data sources.
- Use Power BI to connect to data sources and create visuals.
- Arrange visuals on a dashboard and customize visualizations.
- Publish your dashboard and share it with stakeholders.
Dashboard Design Case Study
Show steps
Solidify your understanding by creating a detailed case study of a well-designed dashboard.
Browse courses on
Dashboard Design
Show steps
- Identify a real-world business scenario and design a dashboard to address it.
- Gather data and create visuals to support your design.
- Write a comprehensive case study that documents your design process and results.
Power BI Dashboard Design Competition
Show steps
Challenging yourself in a competition helps to push your limits and fine-tune your skills in dashboard design.
Browse courses on
Dashboard Design
Show steps
- Find and participate in Power BI dashboard design competitions.
- Create and submit a dashboard that meets the competition requirements.
- Analyze feedback and identify areas for improvement.
Career center
Business Intelligence Analyst
Data Visualization Specialist
Data Scientist
Data Analyst
Data Engineer
Marketing Analyst
Financial Analyst
Operations Research Analyst
User Experience Designer
Information Architect
Technical Writer
Software Engineer
Database Administrator
Project Manager
Business Analyst
Reading list
Share
Similar courses
OpenCourser helps millions of learners each year. People visit us to learn workspace skills, ace their exams, and nurture their curiosity.
Our extensive catalog contains over 50,000 courses and twice as many books. Browse by search, by topic, or even by career interests. We'll match you to the right resources quickly.
Find this site helpful? Tell a friend about us.
We're supported by our community of learners. When you purchase or subscribe to courses and programs or purchase books, we may earn a commission from our partners.
Your purchases help us maintain our catalog and keep our servers humming without ads.
Thank you for supporting OpenCourser.


