May 1, 2024
Updated November 14, 2026
18 minute read

Financial Data Analysis: A Comprehensive Guide
Financial Data Analysis is the process of inspecting, cleaning, transforming, and modeling financial data to discover useful information, inform conclusions, and support decision-making. It involves evaluating a company's financial health and performance by reviewing its financial data, often with the goal of forecasting future financial scenarios, managing risks, and identifying opportunities for growth or improvement. This discipline sits at the intersection of finance, statistics, and computer science, leveraging historical data and sophisticated analytical techniques to turn raw numbers into actionable intelligence.
Working in Financial Data Analysis can be incredibly engaging. Imagine being the person who uncovers a hidden trend in market data that leads to a highly profitable investment strategy, or developing a model that detects fraudulent transactions, saving a company millions. The field also offers the intellectual challenge of solving complex puzzles with data, constantly learning new techniques and technologies to stay ahead. Furthermore, the insights generated directly influence critical business decisions, giving analysts a tangible impact on an organization's success and strategic direction.
For those new to the field, perhaps exploring career options or considering a transition, Financial Data Analysis offers a path into the dynamic world of finance combined with the cutting-edge realm of data science. It's a field that values analytical thinking, problem-solving skills, and a meticulous attention to detail. While the journey requires dedication, the skills acquired are highly transferable and in demand across numerous industries.
Understanding the Core: What is Financial Data Analysis?
h6d129|
Find a path to becoming a Financial Data Analysis. Learn more at:
OpenCourser.com/topic/h6d129/financial
Reading list
We've selected 15 books
that we think will supplement your
learning. Use these to
develop background knowledge, enrich your coursework, and gain a
deeper understanding of the topics covered in
Financial Data Analysis.
University of Chicago professor Ruey Tsay delivers the gold-standard treatise on empirical financial data analysis, covering ARIMA, GARCH volatility clustering, high-frequency transaction data, extreme value theory, and multivariate factor models.
Quantitative analysts and data scientists use Hilpisch's comprehensive O'Reilly handbook to manipulate tick and end-of-day market data with pandas, NumPy, and scikit-learn while building automated algorithmic trading and risk pipelines.
Standard machine learning fails on non-stationary, low signal-to-noise financial series. López de Prado introduces volume-clock bars, fractional differentiation, triple-barrier labeling, meta-labeling, and purged cross-validation.
Cornell professors David Ruppert and David Matteson blend rigorous statistical inference with hands-on financial labs covering heavy-tailed return distributions, copulas, CAPM factor regressions, portfolio optimization, and cointegration.
Campbell, Lo, and MacKinlay define the modern empirical canon of financial economics, uniting event-study methodology, random walk variance-ratio tests, microstructure bid-ask bounce, and term-structure estimation.
Spanning alternative satellite and earnings-call NLP sentiment data to gradient boosting and deep reinforcement learning in Python, Jansen provides end-to-end reproducible workflows for extracting alpha from financial datasets.
Cambridge econometrician Oliver Linton synthesizes modern empirical techniques for high-frequency realized volatility, nonparametric kernel estimation, quantile Value-at-Risk, and network systemic risk modeling.
Published by Chapman & Hall/CRC, Scheuch, Voigt, and Weiss demonstrate how to ingest WRDS, CRSP, Compustat, and TRACE bond datasets in Python to construct reproducible Fama-French factor portfolios and empirical asset pricing tests.
Designed for corporate finance and investment analysts transitioning from spreadsheets to code, Zherlitsyn covers automated financial statement ingestion, exploratory time-series visualization, and Monte Carlo risk simulations.
Avoiding intimidating matrix algebra in favor of intuitive financial applications, Chris Brooks walks students through linear regression, ARCH/GARCH, vector autoregressions, and panel data for empirical finance dissertations.
Originally created by Wes McKinney at AQR Capital Management to solve quantitative financial data alignment problems, pandas remains the foundational tool for resampling, joining, and cleaning irregular financial time series.
Chen bridges modern Python data science workflows with empirical market analysis, walking practitioners through time-series wrangling, factor backtesting, and predictive modeling on real asset datasets.
Cuthbertson and Nitzsche test rational expectations, present-value dividend models, foreign exchange uncovered interest parity, and term-structure hypotheses directly against empirical macroeconomic and market data.
Chronicling how mathematician Jim Simons and speech-recognition pioneers at Renaissance Technologies cleaned decades of granular tick data to uncover non-obvious statistical anomalies in global markets.
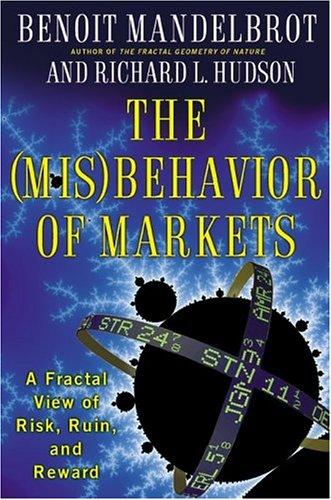
Father of fractal geometry Benoit Mandelbrot challenges Gaussian bell-curve assumptions in financial data, demonstrating how power laws, long-range memory, and multifractal scaling govern real market crashes.
For more information about how these books relate to this course, visit:
OpenCourser.com/topic/h6d129/financial

 Save