Time Series Forecasting
A Comprehensive Guide to Time Series Forecasting
Time series forecasting is a powerful analytical method that involves looking at historical data collected over time to make informed predictions about the future. It's like looking back at the path you've walked to get a better idea of where you might be headed. This technique is widely used across numerous fields, from predicting next year's sales figures in business to forecasting the weather or anticipating stock market trends. By analyzing patterns, trends, and seasonality in past data, organizations and researchers can develop strategies, allocate resources effectively, and prepare for what's to come.
Working in time series forecasting can be quite engaging. Imagine being able to provide insights that help a retail company optimize its inventory for the holiday season, thereby preventing stockouts or overstock situations. Or consider the excitement of developing models that predict energy consumption, helping utility companies manage their resources more efficiently. Furthermore, the field is constantly evolving with the integration of advanced artificial intelligence (AI) and machine learning (ML) techniques, offering opportunities to work with cutting-edge technologies and solve complex predictive challenges.
Fundamental Concepts
To truly understand time series forecasting, it's essential to grasp some of its core concepts. These building blocks will help you understand how forecasters analyze data and make predictions.
Key Components of a Time Series
Time series data typically exhibits several characteristic patterns that data scientists aim to identify and model. Understanding these components is the first step in dissecting a time series and preparing it for forecasting.
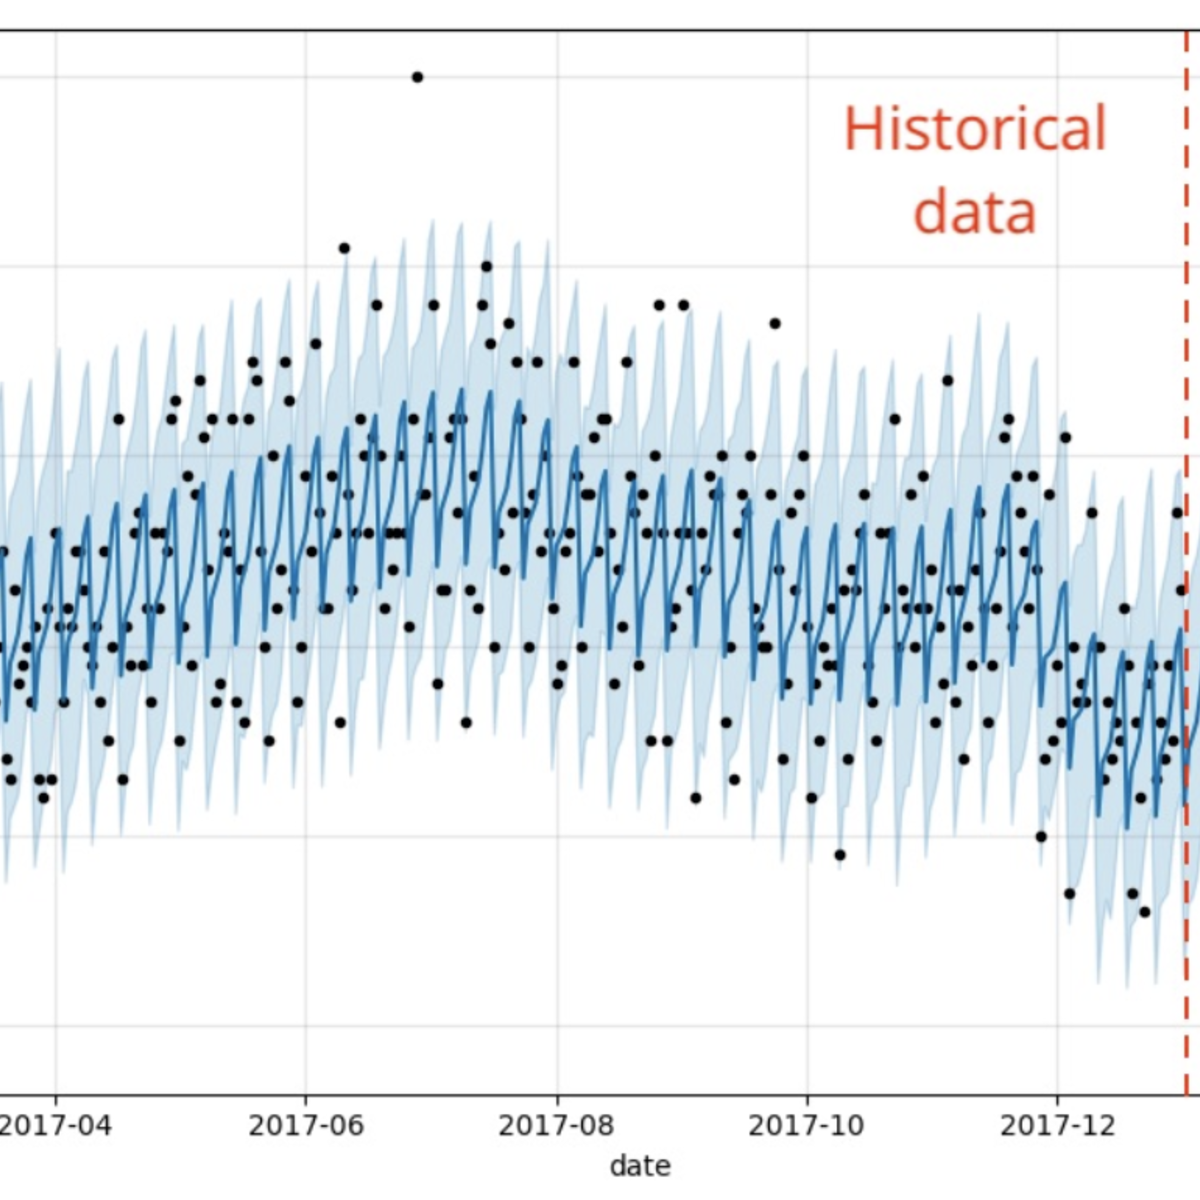
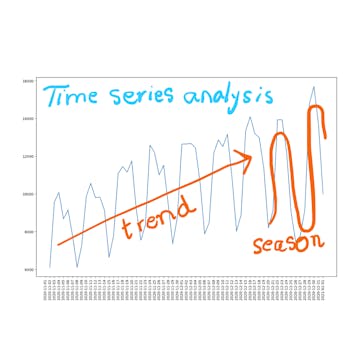
One key component is trend, which refers to a long-term increase or decrease in the data. For example, the consistent growth in a company's sales over several years or the gradual increase in global average temperatures are illustrations of trends. Another important component is seasonality. Seasonal patterns are those that repeat at fixed intervals, such as daily, monthly, or yearly. A classic example is the surge in ice cream sales during the summer months each year.
Cyclical patterns are also observed in time series data. These are longer-term fluctuations that are not of a fixed period, unlike seasonality. Economic recessions and expansions are examples of cyclical patterns. Finally, there's random noise or residuals. This represents the unpredictable, irregular fluctuations in the data that are not explained by trend, seasonality, or cyclical components. These are the random "wiggles" that remain after accounting for the more systematic patterns.
Stationarity
The concept of stationarity is crucial in time series modeling. A time series is considered stationary if its statistical properties, such as mean, variance, and autocorrelation, are constant over time. In simpler terms, a stationary series does not exhibit trends or seasonality. Many time series models assume stationarity because it simplifies the modeling process. If a time series is non-stationary, it often needs to be transformed into a stationary series before applying these models. This is a common preprocessing step in the forecasting workflow.
Why is stationarity so important? When a time series is stationary, its past behavior is a reliable indicator of its future behavior. This makes it much easier to develop models that can accurately capture the underlying patterns and make reliable forecasts. Non-stationary data, on the other hand, can lead to spurious correlations and unreliable predictions because the underlying data generating process is changing over time.
Descriptive Statistics and Visualization
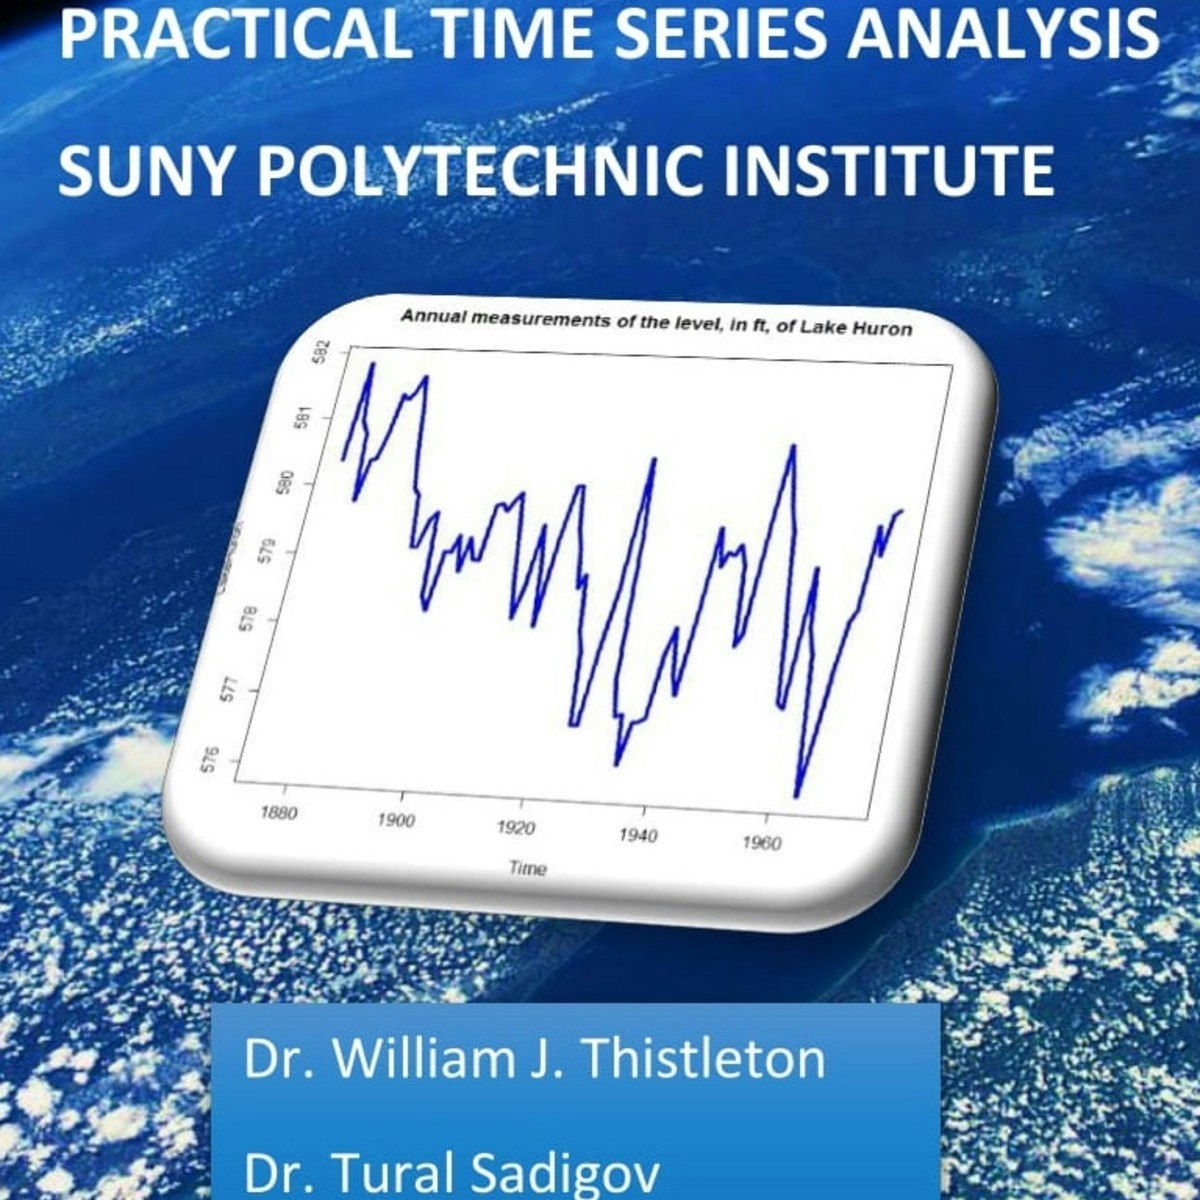
Before diving into complex modeling, forecasters spend significant time understanding the data through descriptive statistics and visualization. A time plot, which is a simple graph of the data values against time, is often the first step. This visual representation can immediately reveal obvious trends, seasonal patterns, or unusual observations.
Other important tools include Autocorrelation Function (ACF) and Partial Autocorrelation Function (PACF) plots. The ACF plot shows the correlation of the time series with its own lagged values, helping to identify the presence of autoregressive (AR) patterns and seasonality. The PACF plot, similarly, helps in identifying the order of AR models by showing the correlation between a time series and its lags after removing the effects of the intermediate lags. These plots are instrumental in selecting appropriate model parameters for traditional statistical models like ARIMA.
Data Preprocessing
Raw time series data is often not in an ideal state for modeling. Therefore, several data preprocessing steps are commonly undertaken. If a series is non-stationary due to a trend, differencing can be applied. This involves computing the difference between consecutive observations, which can help stabilize the mean. For non-constant variance, transformations like the log transformation or Box-Cox transformation can be used to make the variance more uniform.
Another common issue is missing values. These can occur for various reasons, such as data collection errors or system outages. Depending on the nature and extent of the missing data, various imputation techniques might be employed, ranging from simple mean substitution to more sophisticated model-based imputation. Handling these issues appropriately is critical for building robust and accurate forecasting models.
These foundational concepts provide the necessary vocabulary and understanding to explore the diverse range of techniques used in time series forecasting.
For those looking to solidify these fundamental concepts, online courses can provide structured learning paths and practical exercises. These resources often cover the basics of time series components, stationarity, and preprocessing in detail.
The following books are excellent resources for delving deeper into the theoretical underpinnings and practical applications of these core ideas.
You may also wish to explore these related topics to broaden your understanding of the context in which these concepts are applied.
Key Techniques in Time Series Forecasting
Time series forecasting employs a diverse array of techniques, ranging from classical statistical methods to modern machine learning approaches. The choice of technique often depends on the characteristics of the data, the forecasting horizon, and the specific requirements of the application.
Classical Statistical Methods
For decades, statistical methods have been the cornerstone of time series forecasting. These models are often based on the idea that patterns observed in the past will continue into the future. Moving Averages are among the simplest techniques, where the forecast is based on the average of a fixed number of past observations. This method helps to smooth out short-term fluctuations and highlight longer-term trends.
Exponential Smoothing methods are a step up, assigning exponentially decreasing weights to past observations, meaning more recent data points are given greater importance. The Holt-Winters method is a well-known family of exponential smoothing techniques that can explicitly model trend and seasonality. [1, 8j8nfa]
Perhaps one of the most widely known classical methods is ARIMA (Autoregressive Integrated Moving Average). ARIMA models describe the autocorrelations in the data. The "AR" part indicates that the evolving variable of interest is regressed on its own lagged (i.e., prior) values. The "MA" part indicates that the regression error is actually a linear combination of error terms whose values occurred contemporaneously and at various times in the past. The "I" (for "integrated") indicates that the data values have been replaced with the difference between their values and the previous values (and this differencing process may have been performed more than once). SARIMA (Seasonal ARIMA) extends ARIMA to handle seasonal data.
These statistical models provide a strong foundation in forecasting and are often used as benchmarks for more complex methods. They are generally more interpretable and require less data than many machine learning techniques.
These courses offer a good introduction to classical statistical methods in time series forecasting, covering concepts like ARIMA and Exponential Smoothing.
Machine Learning Approaches
In recent years, machine learning (ML) techniques have gained significant traction in time series forecasting, often providing higher accuracy, especially for complex and high-dimensional data. Regression models, including linear regression and more advanced non-linear regression techniques, can be adapted for forecasting by using lagged values of the time series as input features.
Tree-based models like Random Forests and Gradient Boosting Machines (e.g., XGBoost) have also proven effective. These models can capture complex non-linear relationships and interactions between variables without requiring explicit specification of the functional form.
Deep learning models have shown particular promise. Recurrent Neural Networks (RNNs), and specifically Long Short-Term Memory (LSTM) networks and Gated Recurrent Units (GRUs), are designed to handle sequential data and can capture long-range dependencies. More recently, Transformer models, which utilize attention mechanisms, have demonstrated state-of-the-art performance on many time series forecasting tasks, particularly those involving very long sequences. Convolutional Neural Networks (CNNs) can also be applied, often excelling at detecting localized patterns.
Meta's Prophet model is another popular choice, particularly for business forecasting tasks with seasonality and holiday effects. It is designed to be user-friendly and robust to missing data and trend changes.
These courses provide insights into applying machine learning and deep learning techniques for forecasting.
To deepen your understanding of how machine learning is applied in this domain, consider these books.
Hybrid Approaches
Recognizing that different models have different strengths, researchers and practitioners have developed hybrid approaches. These methods combine statistical models with machine learning techniques to leverage the best of both worlds. For instance, a statistical model like ARIMA might be used to capture the linear components of a time series, while a neural network models the residuals (the part of the data that ARIMA couldn't explain), which may contain non-linear patterns. This can often lead to improved forecast accuracy compared to using either method in isolation. The ongoing development of such hybrid models reflects the dynamic nature of the field.
Model Selection Criteria
Choosing the right forecasting model is a critical step. Model selection often depends on various factors, including the characteristics of the data (e.g., length of the series, presence of seasonality, number of variables), the forecasting horizon (short-term vs. long-term), and the interpretability requirements. For example, if the time series is short and exhibits clear linear patterns, a simpler statistical model might be preferred. For long, complex series with potential non-linearities, machine learning models might offer better performance. Evaluation metrics, discussed later, also play a crucial role in comparing candidate models and selecting the most appropriate one for the task at hand.
Exploring resources like OpenCourser's Data Science category can reveal a wealth of information and courses on both classical and machine learning-based forecasting techniques.
Tools and Technologies
Practitioners and researchers in time series forecasting rely on a robust ecosystem of programming languages, libraries, databases, and development environments. Familiarity with these tools is essential for anyone looking to work in this field.
Common Programming Languages
Two programming languages dominate the landscape of data science and, by extension, time series forecasting: Python and R. Python, with its gentle learning curve, extensive libraries, and versatility, has become exceedingly popular. Its clear syntax makes it accessible for beginners, while its powerful libraries cater to advanced users performing complex analyses and building sophisticated machine learning models.
R, on the other hand, was specifically designed for statistical computing and graphics. It boasts a rich collection of packages tailored for time series analysis and classical statistical modeling. Many seminal statistical forecasting methods were first implemented in R, and it remains a favorite among statisticians and academic researchers. The choice between Python and R often comes down to personal preference, specific project requirements, or the existing toolset within an organization. Fortunately, both languages have strong communities and ample learning resources available on platforms like OpenCourser.
Popular Libraries and Frameworks
Within Python, several libraries are indispensable for time series forecasting. Pandas is fundamental for data manipulation and analysis, providing powerful data structures like DataFrames that are well-suited for handling time-indexed data. NumPy forms the basis for numerical computation, offering efficient array operations.
For statistical modeling, Statsmodels is a key Python library, providing implementations of many classical methods like ARIMA, SARIMA, and exponential smoothing, along with tools for statistical tests and diagnostics. Scikit-learn, the go-to library for general machine learning in Python, offers various regression and tree-based models that can be applied to forecasting tasks. Facebook's Prophet library is specifically designed for business time series forecasting and is known for its ease of use and ability to handle seasonality and holidays effectively.
When it comes to deep learning, libraries like Keras, TensorFlow, and PyTorch are the leading frameworks. They provide the building blocks for creating complex neural network architectures, including RNNs, LSTMs, and Transformers, which are increasingly used for advanced time series forecasting. [ax5jib]
In the R ecosystem, packages like forecast (which includes implementations by Professor Rob Hyndman, a leading figure in the field) and tseries are widely used for classical time series analysis and forecasting.
These courses can help you get started with the popular programming languages and libraries used in time series forecasting.
Relevant Database Technologies
Storing and efficiently querying large volumes of time series data requires specialized database solutions. While traditional relational databases can be used, time series databases (TSDBs) are specifically optimized for handling time-stamped data. TSDBs like InfluxDB and TimescaleDB are designed for high ingest rates, efficient storage, and fast querying of time-ordered data. They often include features like data retention policies, continuous queries, and downsampling, which are particularly useful in applications like IoT sensor data monitoring, financial data analysis, and application performance monitoring, all of which can be sources for forecasting.
Development and Deployment Environments
The development and deployment of forecasting models often occur in specific environments. Jupyter Notebooks are a popular choice for interactive data analysis, model development, and visualization. They allow practitioners to combine code, text, and visualizations in a single document, facilitating an exploratory workflow.
For deploying models into production, especially those that require scalability and reliability, cloud platforms like Amazon Web Services (AWS), Google Cloud Platform (GCP), and Microsoft Azure offer a suite of services. These platforms provide tools for data storage, model training (often with GPU support for deep learning), model deployment as APIs, and workflow automation. For example, Google Cloud's Vertex AI offers managed services for building and deploying machine learning models, including those for time series forecasting. [iov5ws, sgltda]
Familiarity with these tools and technologies is crucial for aspiring forecasting professionals, enabling them to move from raw data to actionable predictions efficiently.
Books like these provide practical guidance on using these tools for time series analysis.
Applications Across Industries
Time series forecasting is not just an academic exercise; it's a vital tool with far-reaching applications across a multitude of industries. Its ability to predict future trends based on historical data empowers businesses and organizations to make informed decisions, optimize operations, and mitigate risks.
Finance
The financial sector heavily relies on time series forecasting for various critical functions. Stock price prediction is a classic application, where analysts attempt to forecast the future movements of stock prices based on historical price data, trading volumes, and other market indicators. While notoriously challenging due to the inherent volatility and complexity of financial markets, even marginal improvements in prediction accuracy can lead to significant financial gains. Beyond stock prices, forecasting is used for risk management, helping institutions predict potential losses or assess credit risk.
Algorithmic trading systems often incorporate sophisticated forecasting models to make automated trading decisions in fractions of a second. Furthermore, forecasting is essential for predicting economic indicators like interest rates, inflation, and currency exchange rates, which inform investment strategies and financial planning. The ability to analyze market data and forecast trends is a key skill for financial analysts and quantitative traders.
Courses such as the following delve into financial time series and econometrics.
For those interested in the financial applications, these books are highly relevant.
Retail and Supply Chain
In the retail and supply chain sectors, demand forecasting is paramount. Accurately predicting the future demand for products allows companies to optimize inventory management, ensuring that they have enough stock to meet customer needs without overstocking and incurring unnecessary holding costs. This is particularly crucial for perishable goods or items with short life cycles. Effective demand forecasting helps in planning promotions, managing production schedules, and streamlining logistics.
Time series models can capture seasonal shopping peaks, the impact of marketing campaigns, and other factors influencing consumer purchasing behavior. Improved forecast accuracy translates directly to reduced costs, better customer satisfaction, and increased profitability. Many businesses use sophisticated systems to manage their supply chains, and accurate forecasting is a key input to these systems.
These courses focus on demand forecasting, a critical application in retail and supply chain.
Energy
The energy sector utilizes time series forecasting for load forecasting and price prediction. Utility companies need to predict electricity demand at various time horizons – from minutes ahead to years into the future – to ensure a stable and efficient power supply. Accurate load forecasts help in managing power generation, scheduling maintenance, and making decisions about investments in new infrastructure. With the increasing share of renewable energy sources like solar and wind, which are inherently intermittent, forecasting their generation output has also become critically important.
Energy price forecasting is also crucial for producers, consumers, and traders in energy markets. Predicting fluctuations in oil, gas, and electricity prices helps in making informed purchasing decisions, managing financial risks, and developing hedging strategies.
Healthcare, Economics, and Climate Science
The applications of time series forecasting extend into many other domains. In healthcare, it's used for disease outbreak prediction, helping public health officials anticipate the spread of infectious diseases like influenza and allocate resources accordingly. Patient flow forecasting in hospitals can help optimize staffing and bed management.
In economics, governments and financial institutions rely on forecasts of key macroeconomic variables such as Gross Domestic Product (GDP), inflation rates, and unemployment rates to inform policy decisions and economic planning. For instance, predicting unemployment trends can help policymakers design effective labor market interventions.
Climate science uses time series analysis to model and predict various climate phenomena, including temperature changes, sea-level rise, and patterns of extreme weather events. These forecasts are vital for understanding the impacts of climate change and developing adaptation and mitigation strategies.
The breadth of these applications underscores the versatility and impact of time series forecasting skills in the modern world. Exploring topics like predictive analytics on OpenCourser can provide further insight into how forecasting fits into the broader data science landscape.
Formal Education Pathways
For individuals aspiring to develop deep expertise in time series forecasting, formal education provides a structured and comprehensive route. This path typically involves a progression through various levels of academic study, each building upon the last.
Relevant Coursework in High School
Even at the high school level, students can lay a solid foundation for a future in time series forecasting. Strong mathematical skills are crucial, so courses in algebra, calculus, and pre-calculus are highly recommended. An introduction to statistics will provide a preliminary understanding of data analysis, probability, and hypothesis testing, which are central to forecasting.
Basic computer science courses, particularly those involving programming fundamentals, can also be beneficial. Learning to think algorithmically and gaining initial exposure to coding, perhaps in a language like Python, will ease the transition to more advanced computational work later on. These foundational subjects equip students with the analytical and quantitative reasoning skills necessary for more specialized study at the university level.
Typical University Degree Programs and Relevant Courses
At the university level, several degree programs can lead to a career involving time series forecasting. A Bachelor's degree in Statistics is a direct route, providing in-depth knowledge of statistical theory, modeling techniques, and data analysis. Programs in Data Science are increasingly common and are specifically designed to integrate statistics, computer science, and domain expertise, with time series analysis often being a core component.
A degree in Computer Science, especially with a specialization in machine learning or artificial intelligence, can also provide the necessary computational skills. Economics degrees, particularly those with a strong econometrics focus, heavily involve time series analysis for modeling economic data. Finally, various Engineering disciplines may also incorporate time series analysis for applications like signal processing or control systems.
Key university courses that are highly relevant include Probability Theory, Mathematical Statistics, Econometrics, Machine Learning, Calculus (multivariable), and Linear Algebra. Courses specifically titled "Time Series Analysis" or "Forecasting Methods" are, of course, directly applicable and often a core part of these programs. These courses delve into the theoretical underpinnings of different forecasting models and provide hands-on experience with analyzing time series data.
For students currently in university, supplementing their coursework with specialized online courses can be very beneficial. Platforms like OpenCourser list numerous courses that can deepen understanding or introduce new techniques not covered in a standard curriculum.
These university-level courses, often available through MOOC platforms, can complement formal degree programs.
Focus Areas within Graduate Studies and Research
For those wishing to push the boundaries of knowledge in time series forecasting or pursue research-oriented careers, graduate studies (Master's or PhD) are often necessary. At the Master's level, students typically deepen their understanding of advanced statistical and machine learning techniques, often specializing in areas like financial econometrics, advanced machine learning for sequential data, or specific application domains.
PhD programs involve original research. Focus areas can include the development of novel forecasting methods, such as new deep learning architectures, hybrid models, or techniques for handling specific data challenges like high dimensionality, non-stationarity, or uncertainty quantification. Research might also focus on the theoretical properties of existing methods, the application of forecasting to new and challenging domains, or the intersection of forecasting with other fields like causality or reinforcement learning.
Role of Thesis or Dissertation Work
A significant component of graduate studies, particularly at the PhD level, is the thesis or dissertation. This is an independent research project where the student makes an original contribution to the field. For those specializing in time series forecasting, this could involve developing a new forecasting algorithm, proposing a novel methodology for model evaluation, or conducting an in-depth empirical study applying advanced forecasting techniques to solve a significant real-world problem. The thesis work demonstrates the student's ability to conduct independent research, critically analyze complex problems, and communicate their findings effectively, all of which are crucial skills for advanced roles in academia or industry.
Advanced learners can explore these more specialized courses.
Consider these books for a more in-depth academic perspective.
Online Learning and Self-Study
Beyond formal academic programs, a wealth of online resources and self-study paths are available for those keen to learn time series forecasting. This route offers flexibility and can be particularly appealing for career changers, professionals looking to upskill, or individuals supplementing their existing education.
Availability and Types of Online Resources
The internet is teeming with learning materials for time series forecasting. Massive Open Online Courses (MOOCs) offered by universities and industry experts on platforms discoverable through OpenCourser provide structured learning experiences, often with video lectures, assignments, and projects. Many of these courses cover everything from foundational concepts to advanced deep learning techniques.
Beyond MOOCs, numerous tutorials and blog posts written by practitioners offer practical insights and code examples, often focusing on specific libraries or problem types. Academic research papers, often available on preprint servers like arXiv, provide access to the latest advancements in the field. Open-source projects on platforms like GitHub not only provide code implementations of various models but also serve as valuable learning tools for understanding how these models are built and applied in practice.
These courses are excellent starting points for self-learners.
Feasibility of Using Online Learning for Career Entry or Transition
It is indeed feasible to use online learning as a primary means for entering the field of time series forecasting or transitioning from another career. Many employers value demonstrated skills and project experience over specific degrees, especially for roles that are more applied in nature. Online courses can equip learners with the necessary theoretical knowledge and practical skills in programming, data manipulation, and model building.
However, a self-directed online learning path requires discipline, motivation, and a proactive approach to fill any knowledge gaps. For individuals new to the field, starting with foundational courses in statistics and Python programming before diving into specialized forecasting topics is generally advisable. Successfully navigating a career transition often involves not just acquiring technical skills but also building a portfolio and networking within the field.
Pathways for Independent Learners
Independent learners can structure their study by first mastering the fundamentals: basic statistics, probability, and a programming language like Python, along with core data science libraries (Pandas, NumPy, Matplotlib). Following this, they can move on to specialized time series courses that cover classical methods (ARIMA, Exponential Smoothing) and then progress to machine learning and deep learning approaches (Regression, LSTMs, Transformers).
A crucial aspect of self-study is hands-on practice. Learners should actively seek out datasets to work with. Many public datasets are available from government agencies, academic institutions, and platforms like Kaggle. Applying learned techniques to real-world (or realistic) data helps solidify understanding and build practical skills. Setting clear learning goals and creating a structured curriculum, perhaps by following the syllabus of a reputable university course or a series of MOOCs, can keep learning on track. The OpenCourser Learner's Guide offers valuable tips on how to structure self-learning effectively.
Importance of Building a Portfolio
For individuals learning online or through self-study, a strong portfolio of projects is arguably the most important asset when seeking employment. Theoretical knowledge is valuable, but employers want to see that a candidate can apply that knowledge to solve real problems. Participating in Kaggle competitions focused on forecasting is an excellent way to gain experience and showcase skills. Analyzing publicly available datasets and documenting the process—from data cleaning and exploration to model selection and evaluation—in a blog post or a series of Jupyter Notebooks hosted on GitHub can create compelling portfolio pieces.
Projects could involve forecasting stock prices (with appropriate caveats about its difficulty), predicting energy consumption, forecasting sales for a hypothetical business, or analyzing weather patterns. The key is to demonstrate a solid understanding of the forecasting workflow, the ability to choose and implement appropriate models, and the skill to interpret and communicate the results. Such projects serve as tangible proof of competence and can significantly enhance job prospects.
These project-based courses allow learners to build practical skills and add to their portfolios.
These books can guide independent learners in their project work.
Career Paths and Progression
A strong foundation in time series forecasting opens doors to a variety of roles across numerous industries. The ability to analyze historical data and predict future outcomes is a highly valued skill in today's data-driven world. Career progression often involves moving from entry-level analytical roles to more specialized or senior positions with greater responsibility and impact.
Typical Entry-Level Roles
For individuals starting their careers with forecasting skills, typical entry-level roles include Data Analyst, Business Analyst, or Junior Data Scientist. In these positions, responsibilities might involve collecting and cleaning time series data, performing exploratory data analysis, implementing basic forecasting models (often under supervision), and generating reports to communicate findings to stakeholders. These roles provide valuable hands-on experience and an opportunity to understand how forecasting is applied in a business context.
For example, a Business Analyst in a retail company might use time series techniques to forecast sales for specific product categories, while a Data Analyst in a tech company might analyze website traffic patterns to predict future user engagement. These roles often require a good understanding of statistical concepts and proficiency in tools like Excel, SQL, and a programming language such as Python or R. OpenCourser's Career Development section can provide more insights into these entry-level positions.
Mid-Career and Senior Roles
As professionals gain experience and demonstrate expertise, they can progress to more specialized and senior roles. A Forecasting Specialist or Demand Planner might be responsible for developing and maintaining sophisticated forecasting models for critical business functions, such as inventory management or financial planning. A Quantitative Analyst ("Quant"), particularly in the finance industry, uses advanced mathematical and statistical models, including time series forecasting, for trading, risk management, and investment strategies.
Roles like Machine Learning Engineer or Data Scientist often involve designing and implementing more complex forecasting solutions, potentially using deep learning or other advanced AI techniques. These professionals might also be involved in building the infrastructure for model deployment and monitoring. At the most senior levels, a Research Scientist might focus on developing novel forecasting methodologies or leading research teams in academic or industrial R&D settings. These roles typically require a deeper understanding of advanced modeling techniques, strong problem-solving skills, and often, advanced degrees.
Importance of Domain Expertise
While technical skills in statistics and machine learning are crucial, domain expertise significantly enhances a forecaster's effectiveness. Understanding the specific industry, business processes, and the factors that influence the data being forecasted allows for more insightful model building and interpretation. For example, a demand forecaster in the retail sector who understands consumer behavior, seasonal trends, and the impact of promotions will likely build more accurate and relevant models than someone with purely technical skills.
Domain knowledge helps in identifying relevant external variables (exogenous factors) that can improve forecast accuracy, in validating model assumptions, and in communicating results in a way that is meaningful to business stakeholders. Combining technical proficiency with a deep understanding of the application area is often the hallmark of a highly successful forecasting professional.
Early Career Opportunities
For students and recent graduates looking to break into the field, several early career opportunities can provide invaluable experience. Internships and co-op programs offer practical, real-world experience working on forecasting projects within a company. These placements allow aspiring professionals to apply their academic knowledge, learn from experienced practitioners, and build their professional network.
Research assistantships in university labs or research institutions can provide experience in more cutting-edge or theoretical aspects of forecasting. Participating in data science competitions, such as those hosted on Kaggle, particularly those focused on time series, can also be a great way to hone skills and gain visibility, even before securing a formal role. These early experiences are crucial for building a resume and demonstrating practical capabilities to potential employers.
These courses can help individuals prepare for various roles that utilize forecasting skills.
Evaluating Time Series Forecasting Models
Developing a forecasting model is only half the battle; rigorously evaluating its performance is equally, if not more, important. Proper evaluation ensures that the chosen model is reliable and provides accurate predictions for the intended application. The unique nature of time-dependent data requires specific evaluation strategies.
Common Evaluation Metrics
Several quantitative metrics are commonly used to assess the accuracy of time series forecasts. Mean Absolute Error (MAE) measures the average absolute difference between the predicted values and the actual values, providing an easily interpretable measure of error in the original units of the data. Mean Squared Error (MSE) and Root Mean Squared Error (RMSE) also measure the average squared difference between predicted and actual values. RMSE is often preferred as it is in the same units as the data, but it penalizes larger errors more heavily than MAE due to the squaring term.
Percentage errors like Mean Absolute Percentage Error (MAPE) and symmetric Mean Absolute Percentage Error (sMAPE) express the error as a percentage of the actual values. These are useful for comparing forecast performance across different time series with varying scales. However, MAPE can be problematic when actual values are close to or equal to zero. Mean Absolute Scaled Error (MASE) is another important metric, particularly recommended by forecasting experts, as it compares the model's MAE with the MAE of a naive benchmark forecast (e.g., predicting the last observed value), providing a scale-free and interpretable measure of relative forecast skill.
Importance of a Hold-Out Set
A fundamental principle in model evaluation is to test the model on data it has not seen during training. For time series data, this means using a hold-out set or test set that consists of the most recent observations. It's crucial that this hold-out set respects the temporal order of the data. That is, the training data should always come from a period before the test data. Using future data to train a model that predicts the past would lead to unrealistically optimistic performance estimates and a model that performs poorly on genuinely new data.
The size of the hold-out set depends on factors like the forecasting horizon and the total length of the time series. A common practice is to reserve the last 10-20% of the data for testing, or a period equivalent to the desired maximum forecast horizon.
Backtesting Strategies and Time Series Cross-Validation
While a single hold-out set is useful, more robust evaluation often involves backtesting strategies, also known as time series cross-validation. Unlike standard k-fold cross-validation used in other machine learning tasks (which shuffles data randomly), time series cross-validation must preserve the temporal order. A common technique is rolling forecast origin cross-validation. Here, the model is trained on an initial segment of data, and a forecast is made for the next period (or several periods). Then, the actual observation for that period is added to the training set, the model is (optionally) retrained, and a forecast is made for the subsequent period. This process is repeated, rolling the forecast origin forward through the available data. This provides multiple forecast errors from different time periods, giving a more reliable estimate of the model's future performance.
Forecast Comparison Tests and Benchmarking
Beyond calculating error metrics, it's often necessary to statistically compare the performance of different forecasting models. Forecast comparison tests, such as the Diebold-Mariano test, can help determine if the difference in accuracy between two models is statistically significant or likely due to chance. This adds rigor to the model selection process.
Furthermore, it is always good practice to benchmark any sophisticated forecasting model against simpler, naive methods. A common naive forecast is to predict that the next value will be the same as the last observed value (the "random walk" forecast). If a complex model cannot significantly outperform such a simple benchmark, its utility is questionable. Benchmarking provides a baseline level of performance and helps to justify the use of more complex approaches.
These resources delve into the nuances of model evaluation.
This book offers detailed chapters on model evaluation.
Current Challenges and Future Trends
Despite significant advancements, time series forecasting is a field that continues to grapple with inherent challenges while also embracing exciting new trends driven by innovations in AI and machine learning. Understanding these aspects is crucial for both researchers pushing the boundaries and practitioners applying these techniques in the real world.
Challenges in Time Series Forecasting
One of the persistent challenges is dealing with data quality issues. Real-world time series data is often messy, containing missing values, outliers, or noise, all of which can adversely affect model performance. Non-stationarity, where the statistical properties of the series change over time (e.g., evolving trends or seasonality), also poses a significant hurdle for many traditional models. While techniques exist to address these, they require careful application and may not always be perfectly effective.
The complexity and interpretability of advanced models, particularly deep learning approaches, present another challenge. While models like LSTMs or Transformers can achieve high accuracy, their "black box" nature can make it difficult to understand why they make certain predictions. This lack of interpretability can be a barrier to adoption in high-stakes domains where understanding the reasoning behind a forecast is critical.
Moreover, effectively handling uncertainty and generating reliable probabilistic forecasts (i.e., forecasts that provide a range of possible outcomes and their likelihoods, rather than just a single point estimate) remains an active area of research. Many real-world decisions require an understanding of the potential risks and uncertainties associated with a forecast.
Emerging Trends in the Field
The field is rapidly evolving, with several exciting trends shaping its future. The increasing use of deep learning continues to be a dominant trend, with ongoing research into novel architectures (like Transformers, and more recently, Mamba models) and training techniques tailored for time series data. These models are proving adept at capturing complex patterns and long-range dependencies.
AutoML (Automated Machine Learning) for forecasting is gaining traction, aiming to automate the often time-consuming process of model selection, hyperparameter tuning, and even feature engineering. This can make sophisticated forecasting techniques more accessible to users without deep expertise in machine learning. The development of foundation models for time series, pre-trained on vast amounts of diverse time series data and then fine-tuned for specific tasks, is another promising direction, potentially enabling powerful zero-shot forecasting capabilities.
There's also a growing emphasis on incorporating exogenous variables more effectively. These are external factors that can influence the time series being forecasted (e.g., weather patterns for energy demand, promotions for sales forecasting). Advanced models are increasingly capable of leveraging such information to improve accuracy. Furthermore, techniques from other areas of AI, like reinforcement learning and even Large Language Models (LLMs), are beginning to be explored for their potential in specialized forecasting tasks.
These advancements point towards a future where forecasting models are more accurate, adaptable, and capable of handling increasingly complex scenarios. Staying updated with these trends through resources like research publications and industry blogs is essential for anyone serious about the field.
These courses touch upon some of the newer trends and advanced modeling techniques.
For those interested in the cutting edge, these books explore more advanced topics.
Ethical Considerations and Responsible Forecasting
As time series forecasting becomes more powerful and pervasive, it's crucial to consider the ethical implications and promote responsible practices. Forecasts can significantly influence decisions that impact individuals, businesses, and society, making ethical awareness an indispensable part of a forecaster's toolkit.
Potential Sources of Bias
Time series data can inherit biases present in the processes that generated it. For instance, historical sales data might reflect past discriminatory marketing practices, or crime prediction models trained on biased arrest data could perpetuate and even amplify existing societal inequities. If these biases are not identified and addressed, forecasting models trained on such data will likely produce biased predictions, leading to unfair or detrimental outcomes. It is important to scrutinize data sources and collection methods for potential biases and, where possible, implement techniques to mitigate their impact on the models.
The models themselves can also introduce bias, for example, if they are misspecified or if certain subgroups in the data are underrepresented. Careful model selection and validation, including checking for differential performance across various demographic groups, are essential steps in responsible forecasting.
Ethical Implications in Sensitive Domains
The consequences of forecast errors can vary dramatically depending on the application domain. In sensitive areas like finance, inaccurate forecasts can lead to substantial financial losses for individuals or institutions. In healthcare, flawed predictions regarding disease outbreaks or patient demand could result in inadequate resource allocation, potentially impacting patient care and public health outcomes. When forecasting is used for social resource allocation, such as distributing aid or public services, biased or inaccurate forecasts can lead to inequitable distribution and exacerbate existing disparities.
Forecasters working in these domains have a heightened responsibility to ensure their models are as accurate, fair, and robust as possible. This includes being transparent about the limitations and potential uncertainties associated with their predictions. The responsible deployment of AI, including forecasting models, in the public sector is a topic of ongoing discussion and development.
Need for Transparency and Interpretability
In high-stakes forecasting scenarios, the ability to understand and explain how a model arrives at its predictions – its transparency and interpretability – is paramount. If a model denies someone a loan based on a forecast of their creditworthiness or predicts a high likelihood of recidivism for a criminal defendant, stakeholders have a right to understand the basis for these predictions. "Black box" models, which offer high accuracy but little insight into their decision-making processes, can be problematic in such contexts.
There is a growing research interest in developing techniques for eXplainable AI (XAI) that can provide insights into the workings of complex models, including those used for time series forecasting. Choosing models that are inherently more interpretable, or applying XAI methods to more complex ones, can help build trust and facilitate accountability.
Societal Impact of Widespread Automated Forecasting
The increasing automation of forecasting across various sectors brings both opportunities and challenges. On one hand, it can lead to greater efficiency, better resource allocation, and new services. On the other hand, widespread reliance on automated forecasting systems raises concerns about job displacement for human forecasters, the potential for systemic risks if many entities rely on similar flawed models, and the ethical dilemmas that arise when automated systems make decisions with significant human consequences.
A broader societal conversation is needed about how to govern the development and deployment of automated forecasting technologies to ensure they are used responsibly and for the benefit of society. This includes establishing clear guidelines, ethical frameworks, and oversight mechanisms. Research organizations are actively working on developing taxonomies and frameworks for understanding and mitigating forecasting harms.
Engaging with these ethical dimensions is not a separate task but an integral part of being a professional in the field of time series forecasting. It requires ongoing reflection, a commitment to fairness, and a proactive approach to mitigating potential harms.
For those interested in broader ethical considerations in data science, exploring topics within Social Sciences and Public Policy may provide valuable context.
Frequently Asked Questions (Career Focused)
Embarking on or transitioning into a career involving time series forecasting often brings up many questions. Here are some common inquiries with concise answers to help guide your journey.
What kinds of jobs heavily rely on time series forecasting skills?
A wide array of jobs utilize time series forecasting. In finance, roles like Quantitative Analyst, Financial Analyst, and Risk Manager heavily depend on it. In retail and supply chain, Demand Planners, Inventory Managers, and Supply Chain Analysts use forecasting daily. Data Scientists and Machine Learning Engineers across various industries (tech, energy, healthcare) frequently develop and deploy forecasting models. Business Analysts and Data Analysts also often employ forecasting techniques to inform strategic decisions.
Is a Master's or PhD necessary to work in time series forecasting?
Not necessarily, but it depends on the desired role and depth of involvement. For many applied roles like Data Analyst or Business Analyst using established forecasting tools, a Bachelor's degree in a quantitative field (Statistics, Economics, Computer Science, Data Science) combined with strong practical skills and portfolio projects can be sufficient. However, for research-oriented positions, developing novel forecasting methodologies, or highly specialized roles (e.g., some Quantitative Analyst positions or advanced AI research), a Master's or PhD is often preferred or required. Online courses and self-study can bridge gaps, particularly if focused on building a strong portfolio.
What are the most important programming languages and software tools to learn?
Python and R are the dominant programming languages. For Python, key libraries include Pandas (for data manipulation), NumPy (numerical computing), Statsmodels (classical statistical models), Scikit-learn (general machine learning), Prophet (business forecasting), and deep learning frameworks like TensorFlow and PyTorch. [1, 11, ax5jib] For R, the forecast and tseries packages are fundamental. Familiarity with SQL for data extraction and visualization tools (like Matplotlib/Seaborn in Python, or Tableau) is also highly beneficial. [qw7uiu]
How much advanced mathematics and statistics background is required?
A solid understanding of foundational statistics (probability, hypothesis testing, regression) and calculus is generally required. For more advanced roles or to deeply understand the theory behind models like ARIMA or complex machine learning algorithms, a stronger background in mathematical statistics, linear algebra, and potentially stochastic processes is beneficial. However, many practical forecasting tasks can be accomplished with a good intuitive understanding of the models and proficient use of software libraries, even if one hasn't mastered all the underlying mathematical intricacies. The level of mathematical depth needed often correlates with the seniority and research-focus of the role.
Can I build a career in forecasting primarily through online courses and self-study?
Yes, it is increasingly possible, especially for roles that emphasize practical application over theoretical research. Online courses from reputable platforms, combined with dedicated self-study and, crucially, a strong portfolio of hands-on projects (e.g., Kaggle competitions, personal projects analyzing public datasets), can provide the necessary skills and demonstrate capability to employers. Discipline, a structured learning plan, and networking are key to success on this path. Highlighting your projects and skills on platforms like LinkedIn can also be very helpful. OpenCourser's official blog often features articles that can guide self-learners.
What is the typical salary range for roles involving time series forecasting?
Salaries vary significantly based on location, experience, industry, company size, and the specific role. Entry-level Data Analyst roles might start in the range of $60,000 - $90,000 USD in the United States, while experienced Data Scientists or Machine Learning Engineers specializing in forecasting can command salaries well over $150,000, sometimes exceeding $200,000, especially in high-demand sectors like tech and finance. Roles requiring PhDs or highly specialized expertise in quantitative finance can earn even more. It's advisable to research salary benchmarks for specific roles and locations using resources like Glassdoor or LinkedIn Salary.
Are time series forecasting skills transferable to other data science domains?
Absolutely. The skills developed in time series forecasting are highly transferable to other areas of data science and analytics. Core competencies like data manipulation (cleaning, transforming data), feature engineering, model building, evaluation, and programming (Python/R) are foundational to almost all data science roles. Understanding how to work with sequential data can also be an advantage in related fields like Natural Language Processing (NLP) or Reinforcement Learning. The analytical mindset and problem-solving abilities honed in forecasting are valuable assets in any data-driven career.
These courses can further enhance your understanding and skills in related data science areas.
Time series forecasting is a dynamic and intellectually stimulating field with diverse applications and career opportunities. It combines statistical rigor with the creativity of machine learning, offering a path for those who enjoy uncovering patterns in data and making predictions that can drive impactful decisions. Whether you are just starting to explore this area or are looking to deepen your expertise, the journey of learning time series forecasting is a rewarding one, with ample resources available to support your growth.


