We may earn an affiliate commission when you visit our partners.
Course image
Pluralsight logo

Creating Special-purpose Plots

R Playbook

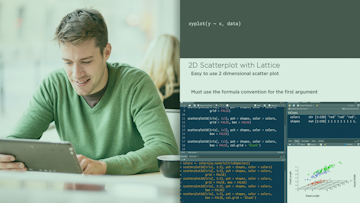
There are many options for creating visualizations in R. In this course, Creating Special-purpose Plots: R Playbook, you will gain the ability to create a multitude of different plots you wouldn't typically be exposed to. First, you will learn how to create...
Read more
There are many options for creating visualizations in R. In this course, Creating Special-purpose Plots: R Playbook, you will gain the ability to create a multitude of different plots you wouldn't typically be exposed to. First, you will learn how to create maps with the Leaflet library. Next, you will discover how to make correlograms with the Corrgram library. Finally, you will explore how to make 3D scatterplots in two different libraries: Lattice and Scatter3d . When you're finished with this course, you will have the skills and knowledge of niche visualizations needed to excel at creating visualizations for any application.
Enroll now

Good to know

Know what's good
, what to watch for
, and possible dealbreakers
Creates visualizations not standard in R
Relevant for data visualization professionals
Includes examples with code and visualizations
Builds on foundational R knowledge
Focuses on niche visualizations
Might require additional R skills

Save this course

Save Creating Special-purpose Plots: R Playbook to your list so you can find it easily later:
Save

Activities

Coming soon We're preparing activities for Creating Special-purpose Plots: R Playbook. These are activities you can do either before, during, or after a course.

Career center

Learners who complete Creating Special-purpose Plots: R Playbook will develop knowledge and skills that may be useful to these careers:
Cartographer
Cartographers create maps that communicate geographic information. They use a variety of techniques to represent data on maps, including symbols, colors, and shading. The Creating Special-purpose Plots: R Playbook course can help you develop the skills needed to create effective maps using the Leaflet library. This course will teach you how to work with geospatial data, create different types of maps, and add features such as interactivity and zoom controls. These skills are essential for cartographers who want to create maps that are both informative and visually appealing.
Geospatial Analyst
Geospatial analysts use geographic data to solve problems and make informed decisions. They work with data from a variety of sources, including satellite imagery, aerial photography, and census data. The Creating Special-purpose Plots: R Playbook course can help you develop the skills needed to work with geospatial data and create visualizations that communicate your findings effectively. This course will teach you how to use R to work with geospatial data, create different types of maps, and interpret the results. These skills are essential for geospatial analysts who want to be able to extract meaningful insights from geospatial data.
Quantitative Analyst
Quantitative analysts use mathematical and statistical techniques to analyze data and make investment decisions. They work in a variety of industries, including finance, insurance, and healthcare. The Creating Special-purpose Plots: R Playbook course can help you develop the skills needed to analyze data and create visualizations that communicate your findings effectively. This course will teach you how to use R to work with data, create different types of plots, and interpret the results. These skills are essential for quantitative analysts who want to be able to make informed investment decisions.
Statistician
Statisticians collect, analyze, and interpret data. They work in a variety of industries, including healthcare, finance, and market research. The Creating Special-purpose Plots: R Playbook course can help you develop the skills needed to analyze data and create visualizations that communicate your findings effectively. This course will teach you how to use R to work with data, create different types of plots, and interpret the results. These skills are essential for statisticians who want to be able to extract meaningful insights from data.
Data Scientist
Data scientists use data to solve problems and make informed decisions. They work with large datasets to identify patterns, trends, and insights. The Creating Special-purpose Plots: R Playbook course can help you develop the skills needed to analyze data and create visualizations that communicate your findings effectively. This course will teach you how to use R to work with data, create different types of plots, and interpret the results. These skills are essential for data scientists who want to be able to extract meaningful insights from data.
Market Researcher
Market researchers collect and analyze data to understand consumer behavior. They use this information to help businesses develop new products and marketing campaigns. The Creating Special-purpose Plots: R Playbook course can help you develop the skills needed to analyze data and create visualizations that communicate your findings effectively. This course will teach you how to use R to work with data, create different types of plots, and interpret the results. These skills are essential for market researchers who want to be able to extract meaningful insights from data.
Software Engineer
Software engineers design, develop, and maintain software systems. They work in a variety of industries, including technology, finance, and healthcare. The Creating Special-purpose Plots: R Playbook course can help you develop the skills needed to visualize data and communicate your findings effectively. This course will teach you how to use R to work with data, create different types of plots, and interpret the results. These skills are essential for software engineers who want to be able to design and develop user-friendly software systems.
Risk Manager
Risk managers identify, assess, and manage risks to organizations. They work in a variety of industries, including finance, insurance, and healthcare. The Creating Special-purpose Plots: R Playbook course can help you develop the skills needed to analyze data and create visualizations that communicate your findings effectively. This course will teach you how to use R to work with data, create different types of plots, and interpret the results. These skills are essential for risk managers who want to be able to make informed decisions about risk management.
UX Researcher
UX researchers study the behavior of users to improve the user experience of products and services. They use a variety of methods to collect data, including surveys, interviews, and usability testing. The Creating Special-purpose Plots: R Playbook course can help you develop the skills needed to analyze data and create visualizations that communicate your findings effectively. This course will teach you how to use R to work with data, create different types of plots, and interpret the results. These skills are essential for UX researchers who want to be able to make informed decisions about user experience.
Operations Research Analyst
Operations research analysts use mathematical and statistical techniques to solve problems and improve the efficiency of organizations. They work in a variety of industries, including manufacturing, healthcare, and transportation. The Creating Special-purpose Plots: R Playbook course can help you develop the skills needed to analyze data and create visualizations that communicate your findings effectively. This course will teach you how to use R to work with data, create different types of plots, and interpret the results. These skills are essential for operations research analysts who want to be able to extract meaningful insights from data.
Web Developer
Web developers design and develop websites. They work with a variety of technologies, including HTML, CSS, and JavaScript. The Creating Special-purpose Plots: R Playbook course can help you develop the skills needed to visualize data and communicate your findings effectively. This course will teach you how to use R to work with data, create different types of plots, and interpret the results. These skills are essential for web developers who want to be able to design and develop user-friendly websites.
Product Manager
Product managers are responsible for the development and launch of new products. They work with engineers, designers, and marketers to bring new products to market. The Creating Special-purpose Plots: R Playbook course can help you develop the skills needed to analyze data and create visualizations that communicate your findings effectively. This course will teach you how to use R to work with data, create different types of plots, and interpret the results. These skills are essential for product managers who want to be able to make informed decisions about product development.

Reading list

We haven't picked any books for this reading list yet.
Beginner's guide to using Tableau, one of the most popular data visualization tools. It covers the basics of Tableau, as well as how to use Tableau to create a variety of charts and graphs.
Classic work on data visualization by John W. Tukey, one of the pioneers of the field. It covers a wide range of topics, from the principles of visual perception to the design of effective charts and graphs.
Practical guide to data visualization using D3.js, a popular JavaScript library for data visualization. It covers a wide range of topics, from the basics of D3.js to the use of D3.js to create a variety of charts and graphs.
Seminal work on the grammar of graphics, a formal language for describing data visualizations. It covers a wide range of topics, from the basics of the grammar of graphics to the use of the grammar of graphics to create a variety of charts and graphs.
Comprehensive handbook of data visualization, covering a wide range of topics, from the basics of visual perception to the design of effective charts and graphs. It great resource for anyone who wants to learn more about data visualization.
Provides a comprehensive overview of data visualization, covering the basics of visual perception, data types, and chart types. It great resource for beginners who want to learn the fundamentals of data visualization.
This classic book by Edward Tufte must-read for anyone interested in data visualization. It covers a wide range of topics, from the principles of visual perception to the design of effective charts and graphs.
Beginner-friendly book that covers the fundamentals of data visualization, including how to choose the right charts and graphs for your data and how to effectively communicate your findings.
Comprehensive guide to data visualization for data scientists. It covers a wide range of topics, from the basics of visual perception to the design of effective charts and graphs. It great resource for data scientists who want to learn more about data visualization.

Share

Help others find this course page by sharing it with your friends and followers:

Similar courses

Similar courses are unavailable at this time. Please try again later.
Our mission

OpenCourser helps millions of learners each year. People visit us to learn workspace skills, ace their exams, and nurture their curiosity.

Our extensive catalog contains over 50,000 courses and twice as many books. Browse by search, by topic, or even by career interests. We'll match you to the right resources quickly.

Find this site helpful? Tell a friend about us.

Affiliate disclosure

We're supported by our community of learners. When you purchase or subscribe to courses and programs or purchase books, we may earn a commission from our partners.

Your purchases help us maintain our catalog and keep our servers humming without ads.

Thank you for supporting OpenCourser.

© 2016 - 2024 OpenCourser