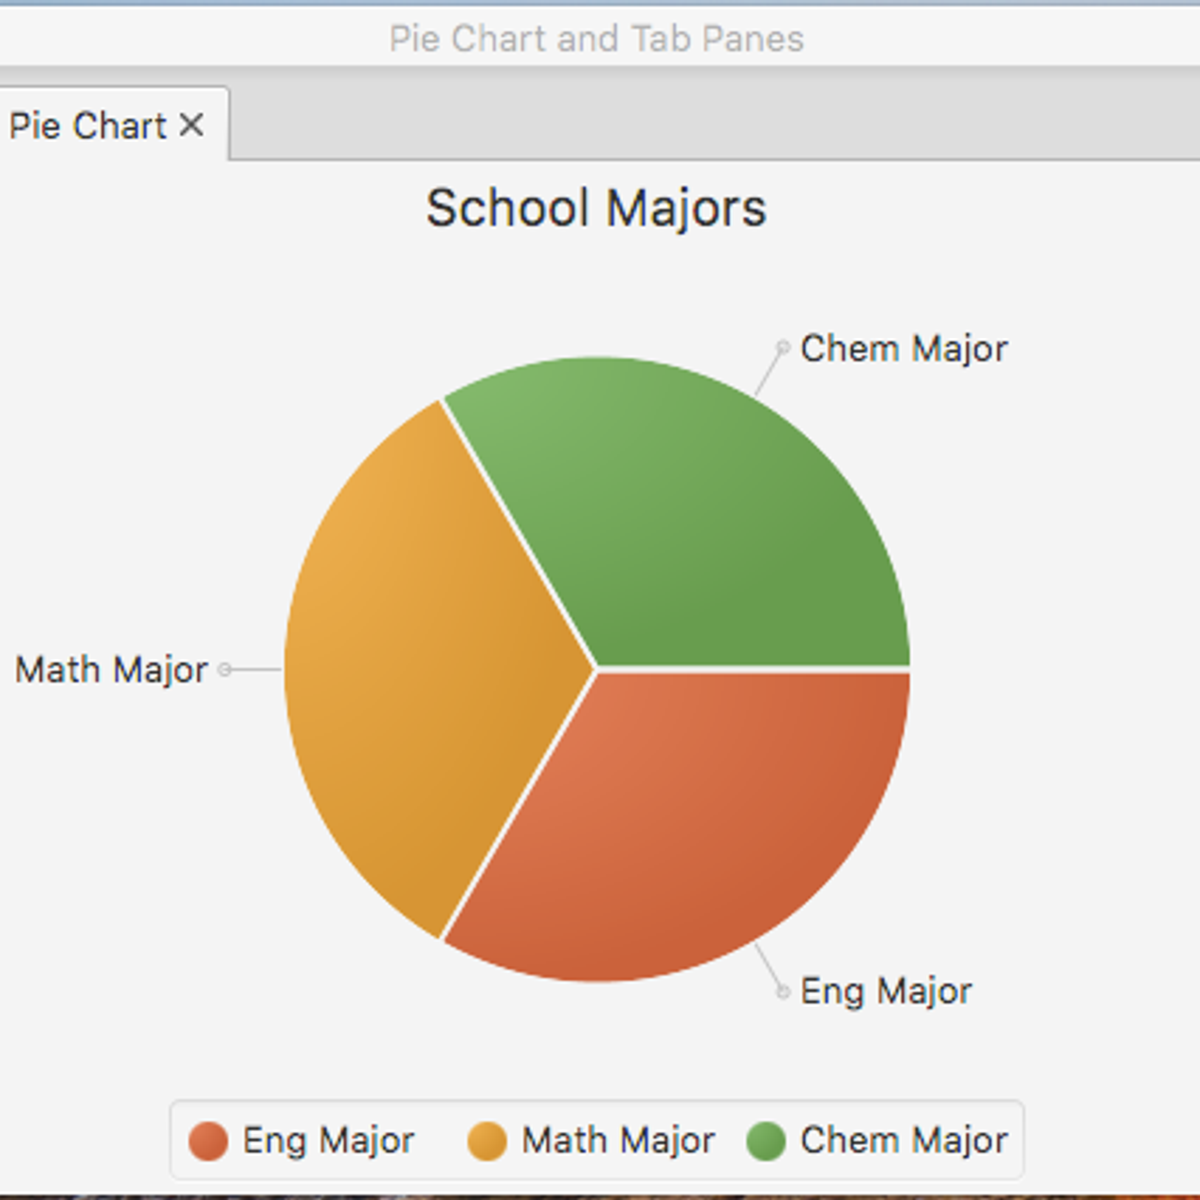


In this project, the learner will create a GUI that contains a tabbed pane with two tabs. The first tab will provide text fields to collect data on the number of students enrolled in English major, Mathematics major, and Chemistry major. When a button is clicked, the data will be shown in a pie chart on the second tab.
Here's a deal for you
What's inside
Syllabus
Traffic lights
Save this course
Reviews summary
Practical javafx gui data display
Activities
Form study groups with classmates
Show steps
Enhance your understanding of concepts by discussing and solving problems with peers.
Browse courses on
Collaboration
Show steps
-
Identify classmates with similar interests and schedules
-
Set up regular study sessions
Seek guidance from experienced programmers
Show steps
Connect with experienced programmers who can provide mentorship and advice on your career path.
Browse courses on
Mentorship
Show steps
-
Attend industry events and meetups
-
Reach out to professionals on LinkedIn
Follow tutorials on specific programming topics
Show steps
Deepen your understanding of programming concepts by following guided tutorials.
Browse courses on
Programming
Show steps
-
Identify topics you want to learn or improve upon
-
Find high-quality tutorials from reputable sources
Five other activities
Expand to see all activities and additional details
Show all eight activities
Review 'Cracking the Coding Interview'
Show steps
Review common algorithms and data structures to prepare for technical interviews.
View
Cracking the Coding Interview: 189 Programming...
on Amazon
Show steps
-
Read each chapter thoroughly
-
Practice solving the corresponding problems at the end of each chapter
Attend coding workshops and hackathons
Show steps
Expand your knowledge and network with other programmers by attending coding workshops and hackathons.
Browse courses on
Software Development
Show steps
-
Research upcoming coding events in your area
-
Register for events that interest you
Practice coding exercises on LeetCode
Show steps
Sharpen coding skills by solving coding challenges.
Browse courses on
Data Structures
Show steps
-
Create a LeetCode account
-
Choose a problem from the problem library
-
Implement a solution in your preferred programming language
Contribute to open-source software projects
Show steps
Gain practical experience and contribute to the software community by working on open-source projects.
Browse courses on
Software Development
Show steps
-
Identify open-source projects that align with your interests
-
Fork the project and create a local copy
-
Make changes to the codebase and submit a pull request
Build a portfolio of personal projects
Show steps
Showcase your technical abilities by building and deploying personal software projects.
Browse courses on
Software Development
Show steps
-
Brainstorm project ideas that align with your interests and skillset
-
Choose a project and develop a plan for implementation
-
Implement the project using appropriate tools and technologies
-
Test and debug your project thoroughly
Form study groups with classmates
Show steps
Enhance your understanding of concepts by discussing and solving problems with peers.
Browse courses on
Collaboration
Show steps
- Identify classmates with similar interests and schedules
- Set up regular study sessions
Seek guidance from experienced programmers
Show steps
Connect with experienced programmers who can provide mentorship and advice on your career path.
Browse courses on
Mentorship
Show steps
- Attend industry events and meetups
- Reach out to professionals on LinkedIn
Follow tutorials on specific programming topics
Show steps
Deepen your understanding of programming concepts by following guided tutorials.
Browse courses on
Programming
Show steps
- Identify topics you want to learn or improve upon
- Find high-quality tutorials from reputable sources
Review 'Cracking the Coding Interview'
Show steps
Review common algorithms and data structures to prepare for technical interviews.
View
Cracking the Coding Interview: 189 Programming...
on Amazon
Show steps
- Read each chapter thoroughly
- Practice solving the corresponding problems at the end of each chapter
Attend coding workshops and hackathons
Show steps
Expand your knowledge and network with other programmers by attending coding workshops and hackathons.
Browse courses on
Software Development
Show steps
- Research upcoming coding events in your area
- Register for events that interest you
Practice coding exercises on LeetCode
Show steps
Sharpen coding skills by solving coding challenges.
Browse courses on
Data Structures
Show steps
- Create a LeetCode account
- Choose a problem from the problem library
- Implement a solution in your preferred programming language
Contribute to open-source software projects
Show steps
Gain practical experience and contribute to the software community by working on open-source projects.
Browse courses on
Software Development
Show steps
- Identify open-source projects that align with your interests
- Fork the project and create a local copy
- Make changes to the codebase and submit a pull request
Build a portfolio of personal projects
Show steps
Showcase your technical abilities by building and deploying personal software projects.
Browse courses on
Software Development
Show steps
- Brainstorm project ideas that align with your interests and skillset
- Choose a project and develop a plan for implementation
- Implement the project using appropriate tools and technologies
- Test and debug your project thoroughly
Career center
Interaction Designer
User Experience Designer
Data Engineer
Data Analyst
Visual Designer
Project Manager
Data Scientist
Quantitative Analyst
Software Engineer
Technical Writer
Web Developer
Java Developer
Information Architect
Product Manager
Assistant Professor
Reading list
Share
Similar courses
OpenCourser helps millions of learners each year. People visit us to learn workspace skills, ace their exams, and nurture their curiosity.
Our extensive catalog contains over 50,000 courses and twice as many books. Browse by search, by topic, or even by career interests. We'll match you to the right resources quickly.
Find this site helpful? Tell a friend about us.
We're supported by our community of learners. When you purchase or subscribe to courses and programs or purchase books, we may earn a commission from our partners.
Your purchases help us maintain our catalog and keep our servers humming without ads.
Thank you for supporting OpenCourser.