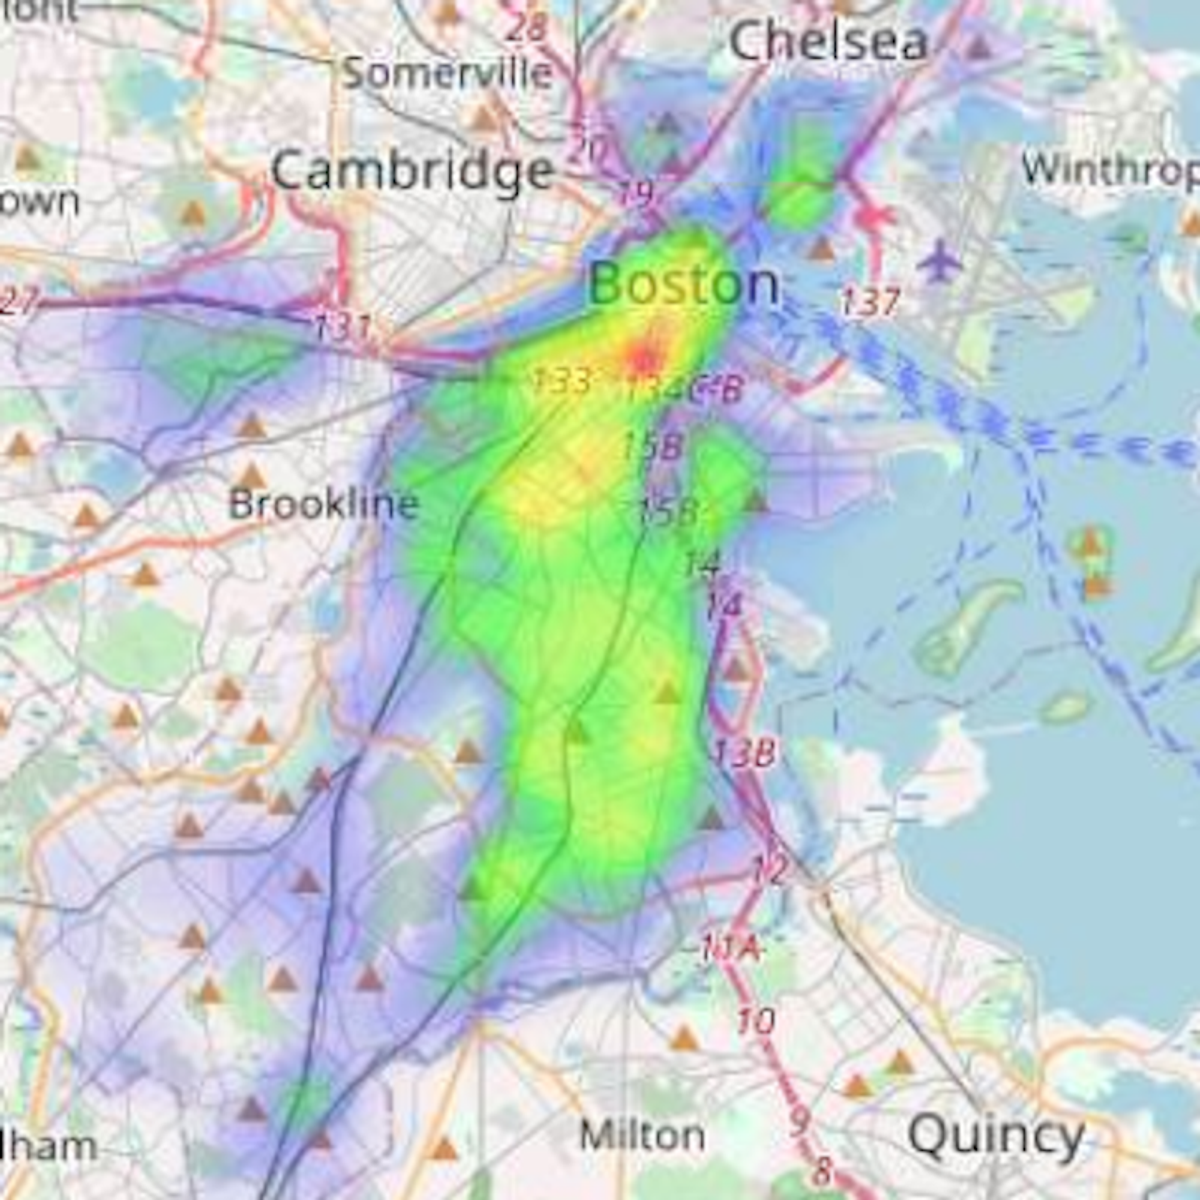


In this one hour long project-based course, you will tackle a real-world problem in data analysis and visualization. You will process a dataset of crime incidents in the city of Boston, and use this data to create an animated heatmap displaying crime hotspots.
Heatmaps use color to display a quantity that changes over two dimensions.
By the end of this project, you will have created heatmaps using code you will write in Python.
Here's a deal for you
What's inside
Syllabus
Traffic lights
Save this course
Reviews summary
Python folium heatmap project
Activities
Read 'Data Visualization: The Fundamentals' by Andy Kirk
Show steps
Gain a foundational understanding of data visualization principles and best practices by reading this comprehensive book.
View
Introduction to Data Visualisation
on Amazon
Show steps
-
Purchase or borrow a copy of the book.
-
Set aside dedicated time each week to read the book.
-
Take notes and highlight key concepts as you read.
-
Apply the principles you learn to your own data visualization projects.
Form a study group with other students in the course
Show steps
Enhance your understanding of the course material and improve your problem-solving skills by collaborating with peers.
Show steps
-
Identify other students in the course who are willing to form a study group.
-
Set regular meeting times and locations.
-
Prepare for each meeting by reviewing the course material and identifying areas where you need support.
-
Meet with your group, discuss the material, and work through problems together.
Attend a data visualization conference or meetup
Show steps
Connect with other data visualization professionals, learn about the latest trends, and get inspired by innovative projects.
Browse courses on
Data Visualization
Show steps
-
Research upcoming data visualization conferences or meetups in your area.
-
Register for the event and make plans to attend.
-
Attend the event, engage with other attendees, and learn from the speakers.
-
Follow up with any connections you make at the event.
Four other activities
Expand to see all activities and additional details
Show all seven activities
Follow tutorials on advanced data visualization techniques
Show steps
Expand your knowledge of data visualization techniques by following tutorials on advanced topics.
Browse courses on
Data Visualization
Show steps
-
Identify specific data visualization techniques you want to learn more about.
-
Search for tutorials or online courses that cover these techniques.
-
Follow the tutorials step-by-step, taking notes and experimenting with the code.
-
Apply the techniques you've learned to your own data visualization projects.
Work through Python practice problems
Show steps
Strengthen your understanding of Python syntax and coding concepts through practice drills.
Browse courses on
Python
Show steps
-
Locate a collection of Python practice problems online.
-
Start working through the problems, one at a time.
-
Take breaks as needed, and review any documentation or resources you need.
-
Once you've completed a problem, check your solution against the provided answer key.
Create an animated heatmap of weather data
Show steps
Reinforce your skills in data manipulation, visualization, and animation by creating an animated heatmap of weather data.
Browse courses on
Data Visualization
Show steps
-
Gather weather data for a specific location and time period.
-
Clean and preprocess the data, removing any outliers or missing values.
-
Use Python and a data visualization library to create an animated heatmap of the data.
-
Export the heatmap as a video or interactive visualization.
Contribute to an open-source data visualization library
Show steps
Deepen your understanding of data visualization techniques and contribute to the community by participating in an open-source project.
Browse courses on
Open Source
Show steps
-
Identify an open-source data visualization library that interests you.
-
Review the library's documentation and codebase.
-
Identify an area where you can contribute, such as adding a new feature or fixing a bug.
-
Submit a pull request with your proposed changes.
Read 'Data Visualization: The Fundamentals' by Andy Kirk
Show steps
Gain a foundational understanding of data visualization principles and best practices by reading this comprehensive book.
View
Introduction to Data Visualisation
on Amazon
Show steps
- Purchase or borrow a copy of the book.
- Set aside dedicated time each week to read the book.
- Take notes and highlight key concepts as you read.
- Apply the principles you learn to your own data visualization projects.
Form a study group with other students in the course
Show steps
Enhance your understanding of the course material and improve your problem-solving skills by collaborating with peers.
Show steps
- Identify other students in the course who are willing to form a study group.
- Set regular meeting times and locations.
- Prepare for each meeting by reviewing the course material and identifying areas where you need support.
- Meet with your group, discuss the material, and work through problems together.
Attend a data visualization conference or meetup
Show steps
Connect with other data visualization professionals, learn about the latest trends, and get inspired by innovative projects.
Browse courses on
Data Visualization
Show steps
- Research upcoming data visualization conferences or meetups in your area.
- Register for the event and make plans to attend.
- Attend the event, engage with other attendees, and learn from the speakers.
- Follow up with any connections you make at the event.
Follow tutorials on advanced data visualization techniques
Show steps
Expand your knowledge of data visualization techniques by following tutorials on advanced topics.
Browse courses on
Data Visualization
Show steps
- Identify specific data visualization techniques you want to learn more about.
- Search for tutorials or online courses that cover these techniques.
- Follow the tutorials step-by-step, taking notes and experimenting with the code.
- Apply the techniques you've learned to your own data visualization projects.
Work through Python practice problems
Show steps
Strengthen your understanding of Python syntax and coding concepts through practice drills.
Browse courses on
Python
Show steps
- Locate a collection of Python practice problems online.
- Start working through the problems, one at a time.
- Take breaks as needed, and review any documentation or resources you need.
- Once you've completed a problem, check your solution against the provided answer key.
Create an animated heatmap of weather data
Show steps
Reinforce your skills in data manipulation, visualization, and animation by creating an animated heatmap of weather data.
Browse courses on
Data Visualization
Show steps
- Gather weather data for a specific location and time period.
- Clean and preprocess the data, removing any outliers or missing values.
- Use Python and a data visualization library to create an animated heatmap of the data.
- Export the heatmap as a video or interactive visualization.
Contribute to an open-source data visualization library
Show steps
Deepen your understanding of data visualization techniques and contribute to the community by participating in an open-source project.
Browse courses on
Open Source
Show steps
- Identify an open-source data visualization library that interests you.
- Review the library's documentation and codebase.
- Identify an area where you can contribute, such as adding a new feature or fixing a bug.
- Submit a pull request with your proposed changes.
Career center
Geographic Information Systems (GIS) Analyst
Law Enforcement Officer
Police Officer
Urban Planner
Data Scientist
Cartographer
Sociologist
Market Research Analyst
Data Analyst
Public Safety Officer
Geographer
Journalist
Information Security Analyst
Risk Analyst
Social Worker
Reading list
Share
Similar courses
OpenCourser helps millions of learners each year. People visit us to learn workspace skills, ace their exams, and nurture their curiosity.
Our extensive catalog contains over 50,000 courses and twice as many books. Browse by search, by topic, or even by career interests. We'll match you to the right resources quickly.
Find this site helpful? Tell a friend about us.
We're supported by our community of learners. When you purchase or subscribe to courses and programs or purchase books, we may earn a commission from our partners.
Your purchases help us maintain our catalog and keep our servers humming without ads.
Thank you for supporting OpenCourser.