We may earn an affiliate commission when you visit our partners.
Course image
Nadine Rodriguez

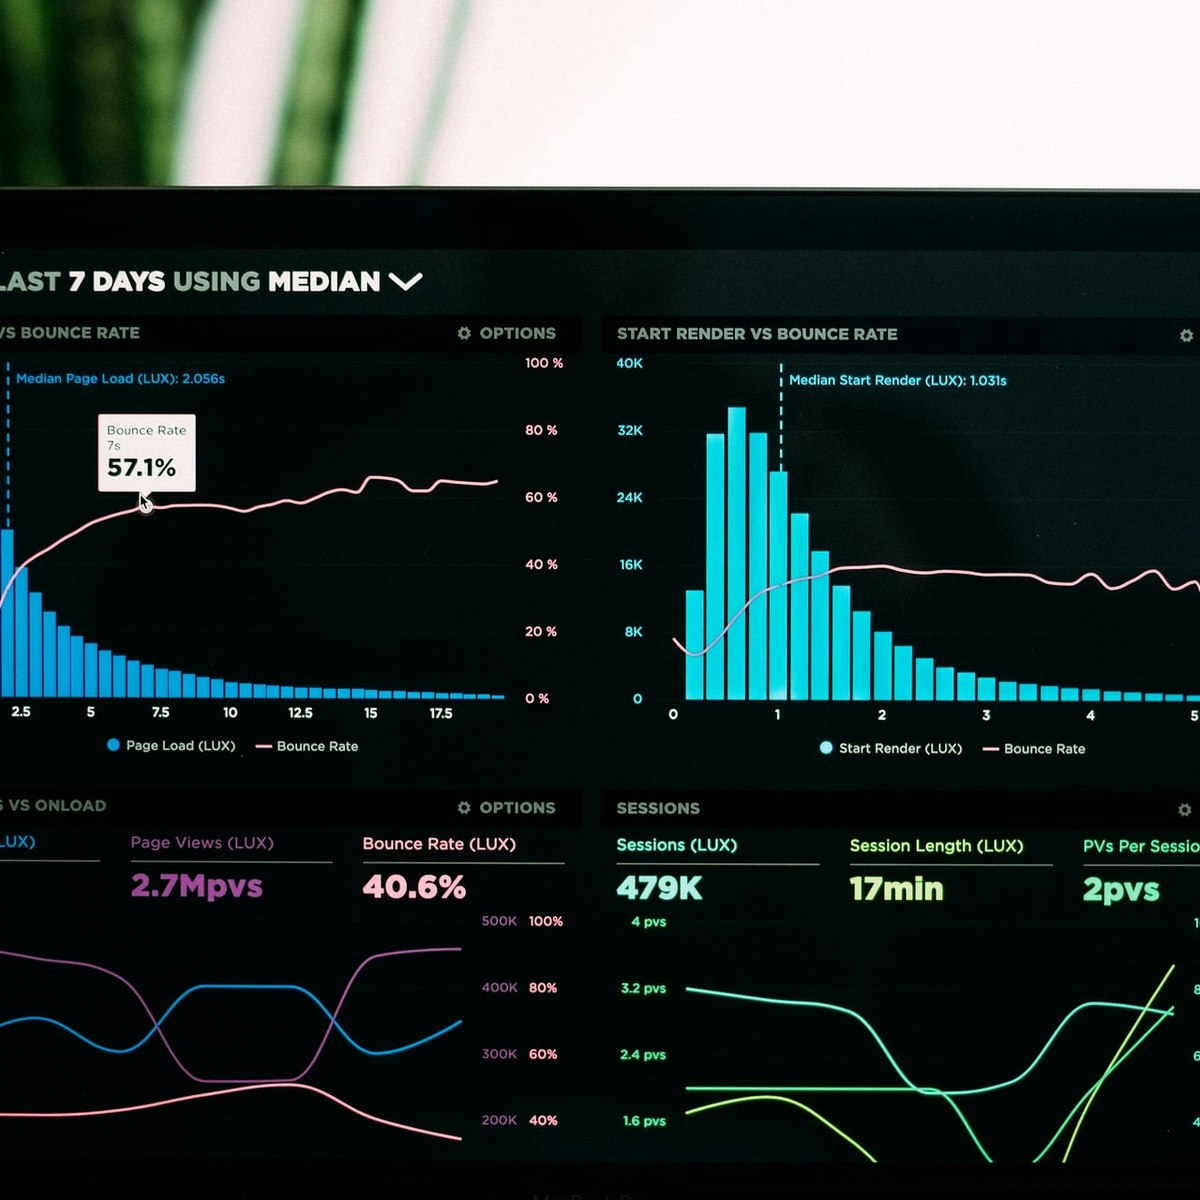
Nach Abschluss dieses Projekts wirst du ein paar Grundregeln der Datenvisualisierung kennengelernt haben und kannst diese bei der Erstellung von Diagrammen anwenden.

Read more

Nach Abschluss dieses Projekts wirst du ein paar Grundregeln der Datenvisualisierung kennengelernt haben und kannst diese bei der Erstellung von Diagrammen anwenden.

Heutzutage kann man Datenvisualisierung in so ziemlicher jedem Fachgebiet finden. Unternehmen zeigen Grafiken, um ihre Umsatzzahlen zu vermelden, Polizeidienststellen erstellen Karten von Verbrechen in der Stadt und auf der Website des Einwohnermeldeamtes kann man visuelle Vergleiche von Zugezogenen und Weggezogenen Einwohnern finden. Aus diesem Grund ist es für viele Menschen unumgänglich sich mit den Grundlagen der Datenvisualisierung auseinanderzusetzen.

Enroll now

What's inside

Syllabus

Projekt-Überblick
Nach Abschluss dieses Projekts wirst du ein paar Grundregeln der Datenvisualisierung kennengelernt haben und kannst diese bei der Erstellung von Diagrammen anwenden. Heutzutage kann man Datenvisualisierung in so ziemlicher jedem Fachgebiet finden. Unternehmen zeigen Grafiken, um ihre Umsatzzahlen zu vermelden, Polizeidienststellen erstellen Karten von Verbrechen in der Stadt und auf der Website des Einwohnermeldeamtes kann man visuelle Vergleiche von Zugezogenen und Weggezogenen Einwohnern finden. Aus diesem Grund ist es für viele Menschen unumgänglich sich mit den Grundlagen der Datenvisualisierung auseinanderzusetzen.

Good to know

Know what's good
, what to watch for
, and possible dealbreakers
Vermittelt grundlegende Regeln für die Erstellung klarer Datenvisualisierungen
Eignet sich für Anfänger, die sich mit dem Thema Datenvisualisierung auseinandersetzen wollen
Vermittelt Kenntnisse, die für das Berichtswesen und die Präsentation von Daten relevant sind

Save this course

Save Einführung in die Datenvisualisierung mit Microsoft Excel to your list so you can find it easily later:
Save

Activities

Be better prepared before your course. Deepen your understanding during and after it. Supplement your coursework and achieve mastery of the topics covered in Einführung in die Datenvisualisierung mit Microsoft Excel with these activities:
Nimm an Datenvisualisierungswettbewerben teil
Motiviert dich, deine Fähigkeiten zu verbessern, kreativ zu sein und von anderen zu lernen.
Browse courses on Innovation
Show steps
  • Recherchiere Datenvisualisierungswettbewerbe
  • Wähle einen Wettbewerb aus, der deinen Interessen entspricht
  • Erstelle eine herausragende Datenvisualisierung für den Wettbewerb
Show all one activities

Career center

Learners who complete Einführung in die Datenvisualisierung mit Microsoft Excel will develop knowledge and skills that may be useful to these careers:
Data Visualization Engineer
Data Visualization Engineers design and develop data visualizations to communicate insights from data. By learning the principles of data visualization, you can create visually appealing and informative visualizations that help users understand data more easily. This course "Einführung in die Datenvisualisierung mit Microsoft Excel" will help you build a foundation in data visualization and prepare you for a successful career in this field.
Graphic designer
Graphic Designers create visual content for a variety of purposes, including marketing, advertising, and web design. By learning the principles of data visualization, you can create visually appealing and informative designs that communicate messages effectively. This course "Einführung in die Datenvisualisierung mit Microsoft Excel" will help you build a foundation in data visualization and prepare you for a successful career in this field.
Web Designer
Web Designers create and maintain websites. By learning the principles of data visualization, you can design websites that are easy to navigate and understand. This course "Einführung in die Datenvisualisierung mit Microsoft Excel" will help you build a foundation in data visualization and prepare you for a successful career in this field.
User Experience (UX) Designer
User Experience (UX) Designers focus on creating user-friendly and visually appealing interfaces. By learning the principles of data visualization, you can design interfaces that are easy to use and understand. This course "Einführung in die Datenvisualisierung mit Microsoft Excel" will help you build a foundation in data visualization and prepare you for a successful career in this field.
Information Architect
Information Architects design and organize websites and other information systems. By learning the principles of data visualization, you can create information systems that are easy to navigate and understand. This course "Einführung in die Datenvisualisierung mit Microsoft Excel" will help you build a foundation in data visualization and prepare you for a successful career in this field.
Public Health Analyst
Public Health Analysts use data to improve the health of communities. By learning the principles of data visualization, you can communicate public health findings effectively to stakeholders. This course "Einführung in die Datenvisualisierung mit Microsoft Excel" will help you build a foundation in data visualization and prepare you for a successful career in this field.
Statistician
Statisticians collect, analyze, and interpret data. By learning the principles of data visualization, you can communicate statistical findings effectively to stakeholders. This course "Einführung in die Datenvisualisierung mit Microsoft Excel" will help you build a foundation in data visualization and prepare you for a successful career in this field.
Software Engineer
Software Engineers design, develop, and maintain software applications. By learning the principles of data visualization, you can create software applications that are easy to use and understand. This course "Einführung in die Datenvisualisierung mit Microsoft Excel" will help you build a foundation in data visualization and prepare you for a successful career in this field.
Data Engineer
Data Engineers design, build, and maintain data pipelines. By learning the principles of data visualization, you can create data pipelines that are easy to understand and maintain. This course "Einführung in die Datenvisualisierung mit Microsoft Excel" will help you build a foundation in data visualization and prepare you for a successful career in this field.
Epidemiologist
Epidemiologists investigate the causes and spread of diseases. By learning the principles of data visualization, you can communicate epidemiological findings effectively to stakeholders. This course "Einführung in die Datenvisualisierung mit Microsoft Excel" will help you build a foundation in data visualization and prepare you for a successful career in this field.
Business Analyst
Business Analysts use data to identify and solve business problems. By learning to create clear and concise data visualizations, you can communicate insights effectively to stakeholders and help drive data-driven decision-making. This course "Einführung in die Datenvisualisierung mit Microsoft Excel" may be useful in developing the skills needed to succeed in this field.
Data Scientist
Data Scientists use statistical and machine learning techniques to extract insights from data. The ability to visualize data effectively is a key skill for Data Scientists, as it allows them to communicate their findings clearly to stakeholders. This course "Einführung in die Datenvisualisierung mit Microsoft Excel" may be useful in developing the skills needed to succeed in this field.
Market Researcher
Market Researchers use data to understand consumer behavior and trends. By learning to create clear and concise data visualizations, you can communicate insights effectively to stakeholders and help drive data-driven decision-making. This course "Einführung in die Datenvisualisierung mit Microsoft Excel" may be useful in developing the skills needed to succeed in this field.
Data Analyst
Data Analysts focus on collecting, cleaning, and analyzing data to help businesses make better decisions. By learning to create clear and concise data visualizations, you can communicate insights effectively to stakeholders and help drive data-driven decision-making. This course "Einführung in die Datenvisualisierung mit Microsoft Excel" may be useful in developing the skills needed to succeed in this field.
Financial Analyst
Financial Analysts use data to evaluate investments and make financial recommendations. By learning to create clear and concise data visualizations, you can communicate insights effectively to stakeholders and help drive data-driven decision-making. This course "Einführung in die Datenvisualisierung mit Microsoft Excel" may be useful in developing the skills needed to succeed in this field.

Reading list

We've selected eight books that we think will supplement your learning. Use these to develop background knowledge, enrich your coursework, and gain a deeper understanding of the topics covered in Einführung in die Datenvisualisierung mit Microsoft Excel.
Dieses Buch bietet eine praktische Anleitung zur Erstellung effektiver Datenvisualisierungen. Es behandelt Themen wie die Auswahl des richtigen Diagrammtyps, die Verwendung von Farben und Schriftarten und die Optimierung der Visualisierungen für verschiedene Zielgruppen.
Dieses Buch bietet eine grundlegende Einführung in die Prinzipien der Datenvisualisierung. Es behandelt Themen wie die Wahrnehmung von Daten, die Verwendung von Farbe und Schrift und die Gestaltung effektiver Diagramme.
Dieses Buch ist ein Klassiker auf dem Gebiet der Datenvisualisierung. Es bietet eine umfassende Abhandlung über die Prinzipien des effektiven Datenvisualisierungsdesigns.
Dieses Buch bietet eine umfassende Anleitung zur Erstellung von Dashboards und Berichten in Microsoft Excel. Es deckt die Grundlagen der Datenvisualisierung ab und führt in die Erstellung von komplexen Dashboards und Berichten ein.
Dieses Buch bietet eine umfassende Einführung in die Wahrnehmung, das Design und die Evaluierung von Datenvisualisierungen. Es behandelt Themen wie die kognitive Verarbeitung, die visuelle Wahrnehmung und die Gestaltung effektiver Visualisierungen.
Dieses Buch bietet eine praktische Anleitung zur Auswahl des richtigen Diagrammtyps für jede Situation. Es behandelt Themen wie die kognitive Verarbeitung, die visuelle Wahrnehmung und die Gestaltung effektiver Visualisierungen.
Dieses Buch bietet eine umfassende Einführung in die Datenvisualisierung, das Design und die Statistik. Es behandelt Themen wie die kognitive Verarbeitung, die visuelle Wahrnehmung und die Gestaltung effektiver Visualisierungen.

Share

Help others find this course page by sharing it with your friends and followers:

Similar courses

Here are nine courses similar to Einführung in die Datenvisualisierung mit Microsoft Excel.
Ubuntu/Debian: Linux Heim-Server und Docker für...
Most relevant
Datenanalyse verwalten
Most relevant
Social Entrepreneurship – von der Idee zur Umsetzung
Most relevant
Nachhaltigkeit lehren lernen
Most relevant
Untersuchen und Erstellen von Daten für Unternehmen
Most relevant
Erfolgreich Verhandeln: Strategien und Fähigkeiten
Most relevant
Gemini for Data Scientists and Analysts - Deutsch
Most relevant
Einstieg in die Raeumliche Datenanalyse mit GeoDa
Most relevant
Ethical Hacking mit Python in der Praxis: Der Komplettkurs
Most relevant
Our mission

OpenCourser helps millions of learners each year. People visit us to learn workspace skills, ace their exams, and nurture their curiosity.

Our extensive catalog contains over 50,000 courses and twice as many books. Browse by search, by topic, or even by career interests. We'll match you to the right resources quickly.

Find this site helpful? Tell a friend about us.

Affiliate disclosure

We're supported by our community of learners. When you purchase or subscribe to courses and programs or purchase books, we may earn a commission from our partners.

Your purchases help us maintain our catalog and keep our servers humming without ads.

Thank you for supporting OpenCourser.

© 2016 - 2024 OpenCourser