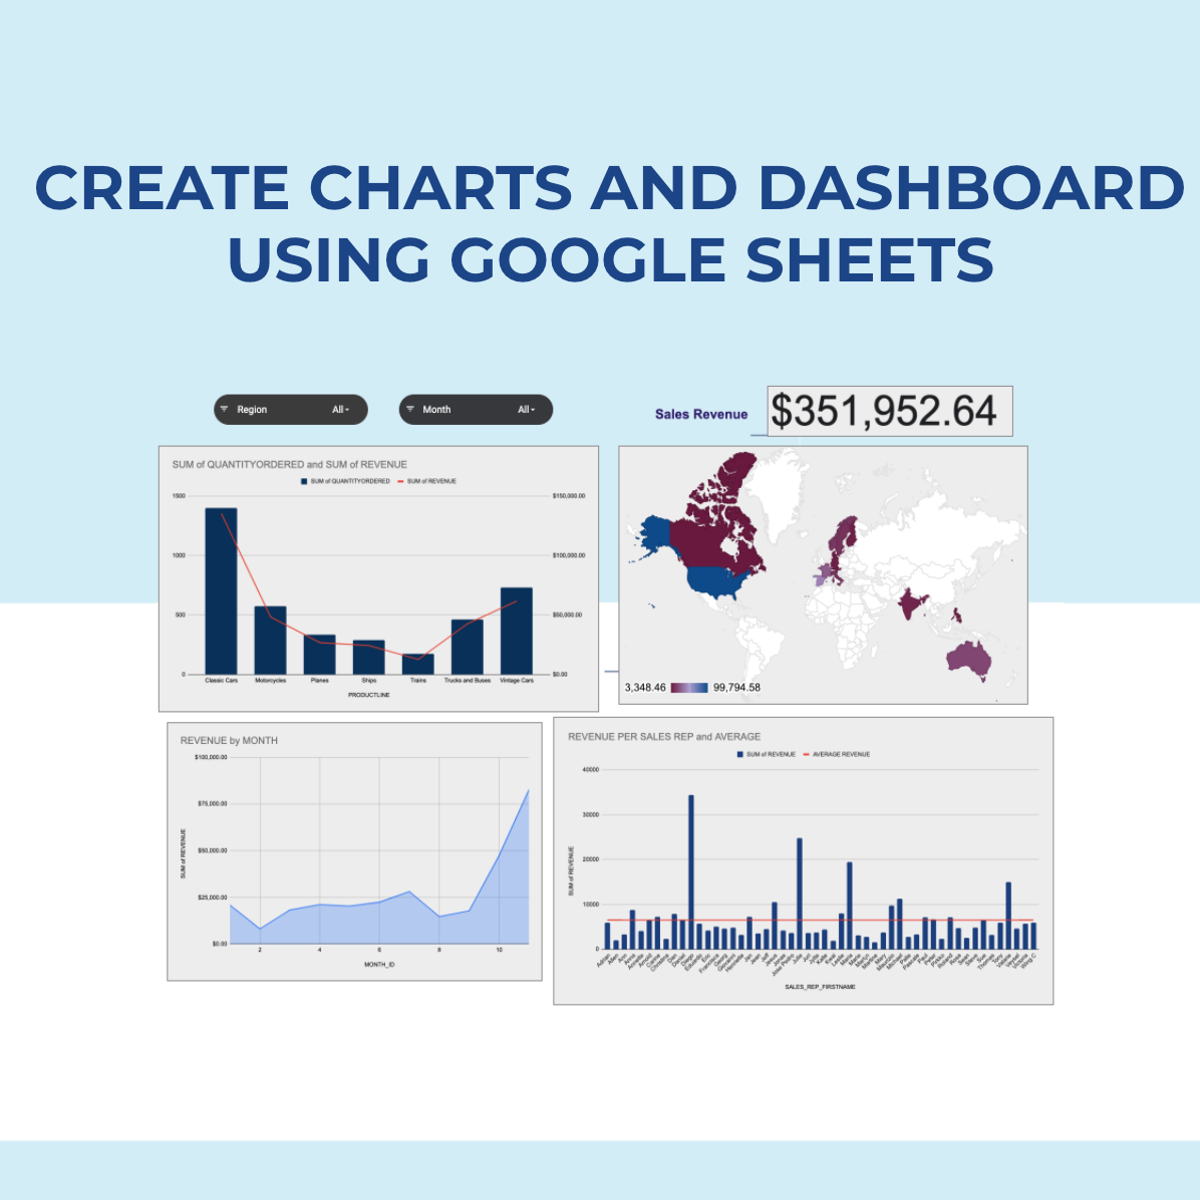


In this 2-hour long project-based course, you will learn how to create effective charts and a dynamic dashboard to visualize data sets. You will be able to work with vlookups, pivot tables and basic formulas and be able to create dynamic charts, sparklines, and a robust, dynamic dashboard to present the data.
By the end of the project you will be able to:
- Understand the terminologies of spreadsheets
- Work with basic formulas in Google Sheets
- Create 8 Basic Charts for visualizing data
- Generate Dynamic Charts from a dropdown list
- Generate Sparklines to represent data
Read more
In this 2-hour long project-based course, you will learn how to create effective charts and a dynamic dashboard to visualize data sets. You will be able to work with vlookups, pivot tables and basic formulas and be able to create dynamic charts, sparklines, and a robust, dynamic dashboard to present the data.
By the end of the project you will be able to:
- Understand the terminologies of spreadsheets
- Work with basic formulas in Google Sheets
- Create 8 Basic Charts for visualizing data
- Generate Dynamic Charts from a dropdown list
- Generate Sparklines to represent data
- Build a dashboard and introduce Basic and Advanced Charts
- Use Slicers to filter data and create a robust and dynamic dashboard
Note: If you don't have a Google account, you will need to create one to be able to complete the content.
Here's a deal for you
What's inside
Syllabus
Traffic lights
Save this course
Reviews summary
Google sheets dashboard essentials for beginners
Activities
Review the book 'Google Sheets for Data Analysis' by Ben Collins
Show steps
Review the book 'Google Sheets for Data Analysis' to gain a deeper understanding of data analysis techniques using Google Sheets.
View
Typographic Design: Form and Communication
on Amazon
Show steps
-
Read the book and take notes on key concepts
-
Apply the techniques described in the book to your own projects
Gather resources on data visualization best practices and tools
Show steps
Gather resources on data visualization best practices and tools to enhance your knowledge and skills.
Browse courses on
Data Visualization
Show steps
-
Search for articles, tutorials, and other resources on data visualization
-
Create a collection of useful resources
-
Review the resources and apply the best practices to your own work
Create basic charts to visualize different types of data
Show steps
Create basic charts to visualize different types of data and practice your charting skills.
Show steps
-
Gather sample data
-
Create different types of charts (e.g., bar, line, pie)
-
Analyze the charts and identify key insights and trends
Five other activities
Expand to see all activities and additional details
Show all eight activities
Join a study group or online forum and discuss data visualization techniques
Show steps
Join a study group or online forum to discuss data visualization techniques and learn from others.
Browse courses on
Data Visualization
Show steps
-
Find a study group or online forum
-
Participate in discussions and ask questions
-
Share your own knowledge and insights
Practice using vlookups, pivot tables, and basic formulas in Google Sheets
Show steps
Practice using vlookups, pivot tables, and basic formulas to improve your proficiency in Google Sheets.
Browse courses on
Google Sheets
Show steps
-
Find and use vlookups to retrieve data
-
Create and use pivot tables to summarize and analyze data
-
Use basic formulas to perform calculations and manipulate data
Create a dashboard using Google Sheets
Show steps
Build a dashboard to visualize data, reinforcing your understanding of charts, formulas, and data manipulation techniques.
Browse courses on
Google Sheets
Show steps
-
Organize data in a Google Sheet
-
Learn and apply basic formulas
-
Create visualizations using charts
-
Build a dynamic dashboard
Follow online tutorials on creating dynamic charts and dashboards in Google Sheets
Show steps
Follow online tutorials to learn how to create dynamic charts and dashboards in Google Sheets.
Browse courses on
Dynamic Charts
Show steps
-
Find and watch tutorials on creating dynamic charts
-
Find and watch tutorials on creating dashboards
-
Follow the steps in the tutorials and try creating your own charts and dashboards
Create a data visualization dashboard using Google Sheets
Show steps
Create a data visualization dashboard to showcase your understanding of Google Sheets and data visualization techniques.
Browse courses on
Data Visualization
Show steps
-
Gather and clean the data
-
Create charts and graphs to visualize the data
-
Design and create a professional-looking dashboard
Review the book 'Google Sheets for Data Analysis' by Ben Collins
Show steps
Review the book 'Google Sheets for Data Analysis' to gain a deeper understanding of data analysis techniques using Google Sheets.
View
Typographic Design: Form and Communication
on Amazon
Show steps
- Read the book and take notes on key concepts
- Apply the techniques described in the book to your own projects
Gather resources on data visualization best practices and tools
Show steps
Gather resources on data visualization best practices and tools to enhance your knowledge and skills.
Browse courses on
Data Visualization
Show steps
- Search for articles, tutorials, and other resources on data visualization
- Create a collection of useful resources
- Review the resources and apply the best practices to your own work
Create basic charts to visualize different types of data
Show steps
Create basic charts to visualize different types of data and practice your charting skills.
Show steps
- Gather sample data
- Create different types of charts (e.g., bar, line, pie)
- Analyze the charts and identify key insights and trends
Join a study group or online forum and discuss data visualization techniques
Show steps
Join a study group or online forum to discuss data visualization techniques and learn from others.
Browse courses on
Data Visualization
Show steps
- Find a study group or online forum
- Participate in discussions and ask questions
- Share your own knowledge and insights
Practice using vlookups, pivot tables, and basic formulas in Google Sheets
Show steps
Practice using vlookups, pivot tables, and basic formulas to improve your proficiency in Google Sheets.
Browse courses on
Google Sheets
Show steps
- Find and use vlookups to retrieve data
- Create and use pivot tables to summarize and analyze data
- Use basic formulas to perform calculations and manipulate data
Create a dashboard using Google Sheets
Show steps
Build a dashboard to visualize data, reinforcing your understanding of charts, formulas, and data manipulation techniques.
Browse courses on
Google Sheets
Show steps
- Organize data in a Google Sheet
- Learn and apply basic formulas
- Create visualizations using charts
- Build a dynamic dashboard
Follow online tutorials on creating dynamic charts and dashboards in Google Sheets
Show steps
Follow online tutorials to learn how to create dynamic charts and dashboards in Google Sheets.
Browse courses on
Dynamic Charts
Show steps
- Find and watch tutorials on creating dynamic charts
- Find and watch tutorials on creating dashboards
- Follow the steps in the tutorials and try creating your own charts and dashboards
Create a data visualization dashboard using Google Sheets
Show steps
Create a data visualization dashboard to showcase your understanding of Google Sheets and data visualization techniques.
Browse courses on
Data Visualization
Show steps
- Gather and clean the data
- Create charts and graphs to visualize the data
- Design and create a professional-looking dashboard
Career center
Data Analyst
Business Intelligence Analyst
Data Scientist
Statistician
Financial Analyst
Market Research Analyst
Operations Research Analyst
Quantitative Analyst
Risk Analyst
Data Visualization Specialist
Information Security Analyst
Software Engineer
Web Developer
Database Administrator
Computer Systems Analyst
Reading list
Share
Similar courses
OpenCourser helps millions of learners each year. People visit us to learn workspace skills, ace their exams, and nurture their curiosity.
Our extensive catalog contains over 50,000 courses and twice as many books. Browse by search, by topic, or even by career interests. We'll match you to the right resources quickly.
Find this site helpful? Tell a friend about us.
We're supported by our community of learners. When you purchase or subscribe to courses and programs or purchase books, we may earn a commission from our partners.
Your purchases help us maintain our catalog and keep our servers humming without ads.
Thank you for supporting OpenCourser.