We may earn an affiliate commission when you visit our partners.
Course image
Moses Gummadi

Welcome to RStudio for Six Sigma - Basic Description Statistics. This is a project-based course which should take approximately 2 hours to finish. Before diving into the project, please take a look at the course objectives and structure.

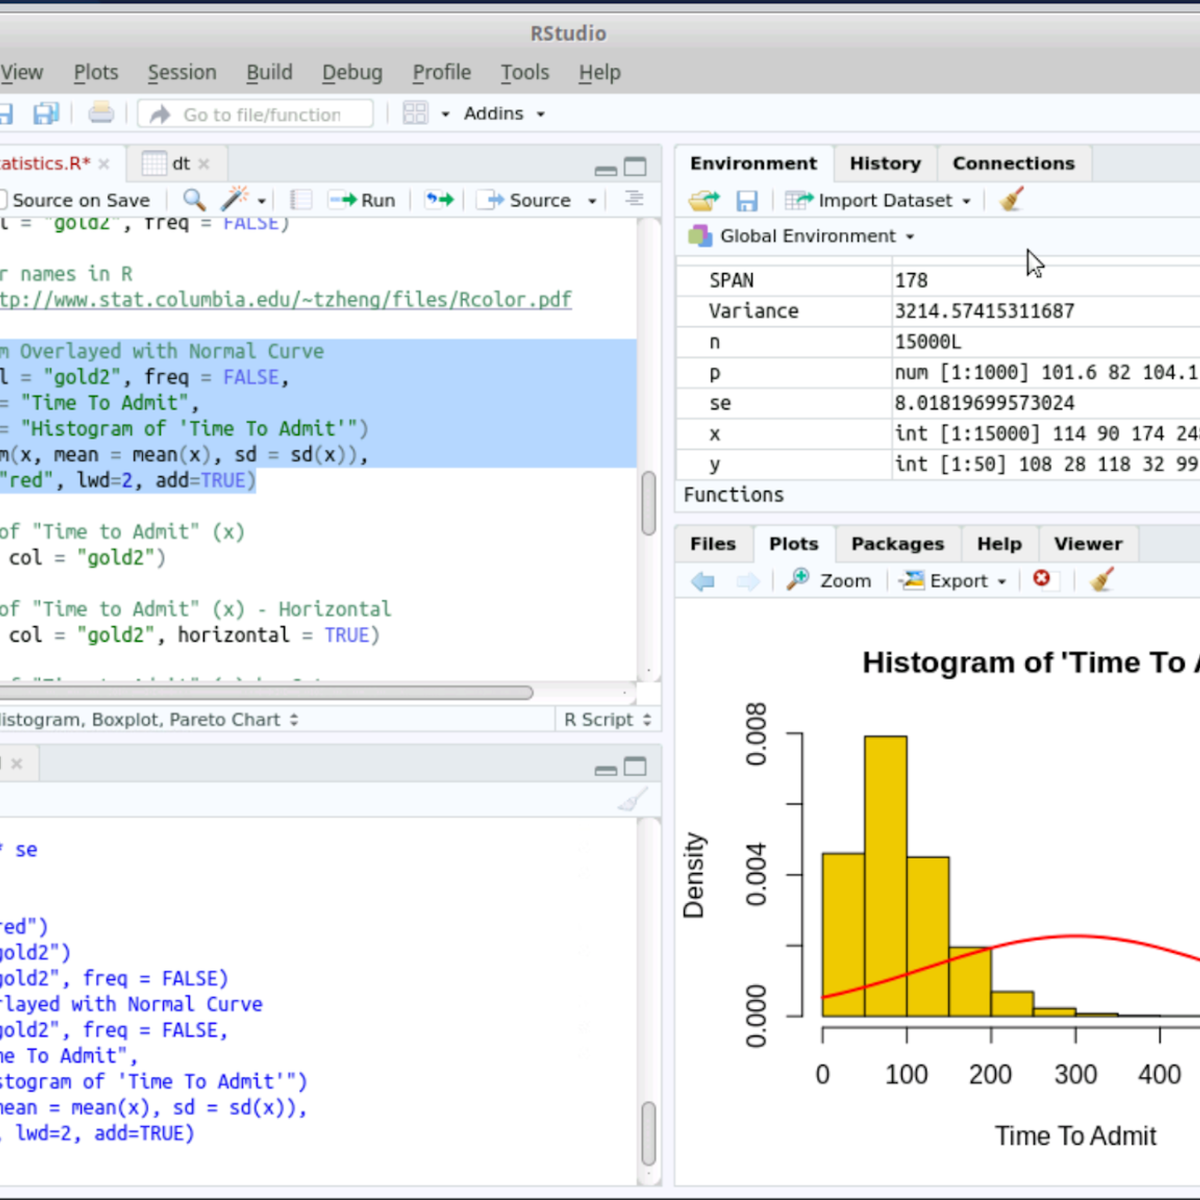
By the end of this project, you will learn to perform Basic Descriptive Analysis (Six Sigma) tasks hands-on using RStudio. Both R language and RStudio tools are Open Source and can be used for most Six Sigma analysis tasks without needing commercial software.

Enroll now

Here's a deal for you

Save money when you learn with a deal that may be relevant to this course.
All coupon codes, vouchers, and discounts are applied automatically unless otherwise noted.

What's inside

Syllabus

Traffic lights

Read about what's good
what should give you pause
and possible dealbreakers
Geared towards learners who need to perform basic descriptive analysis tasks using RStudio for Six Sigma
Suitable for beginners seeking hands-on experience with RStudio for Six Sigma
Provides a solid foundation in basic descriptive analysis using RStudio
Does not cover advanced or intermediate topics in descriptive analysis or Six Sigma
May not be suitable for experienced professionals seeking in-depth knowledge of Six Sigma

Save this course

Create your own learning path. Save this course to your list so you can find it easily later.
Save

Reviews summary

Hands-on rstudio for six sigma basics

According to learners, this course provides a practical, hands-on introduction to Basic Descriptive Statistics using RStudio for Six Sigma. Students appreciate its concise, project-based format, making it ideal for quick skill acquisition. The course is particularly praised for its focus on open-source R and RStudio tools, offering a cost-effective alternative to commercial software. While highly beneficial for beginners, some reviews indicate it may be too basic for those with prior experience in R or Six Sigma.
A short, to-the-point course for specific learning.
"It's quite short, so don't expect deep dives, but for a quick practical application, it's great."
"A short but effective course. It delivers on its promise to teach basic descriptive analysis using RStudio."
"I completed it quickly, but it didn't add much new information for me. Good for absolute beginners though."
Highlights the value of open-source R and RStudio.
"I appreciated learning how to use R and RStudio for these tasks without needing expensive commercial software."
"The open-source tools aspect is a big plus."
"The emphasis on using R and RStudio as open-source alternatives to commercial software is a significant benefit."
An ideal starting point for those new to R or Six Sigma.
"As a beginner to R and Six Sigma, this course was perfect. It's concise, focuses on practical application, and the step-by-step guidance was easy to follow."
"This course is highly recommended for anyone starting in Six Sigma with R."
"It's okay, but if you already have some R or Six Sigma experience, you might find it too basic. Good for absolute beginners though."
Course excels in practical, project-based learning with RStudio.
"This course was an excellent hands-on introduction to descriptive statistics in RStudio for Six Sigma. The instructor was clear and the project format made it very practical."
"The project was useful for getting my hands dirty with RStudio. For a quick practical application, it's great."
"Very clear and helpful for basic descriptive statistics. The focus on RStudio and Six Sigma methodology is exactly what I needed for my job. The hands-on project solidified the concepts."
May lack depth for learners with existing R/Six Sigma knowledge.
"It's okay, but if you already have some R or Six Sigma experience, you might find it too basic. I completed it quickly, but it didn't add much new information for me."
"Could be a bit more challenging, but for its stated purpose, it's solid."
"I wish there were more advanced topics or follow-up courses, as this felt introductory."

Activities

Be better prepared before your course. Deepen your understanding during and after it. Supplement your coursework and achieve mastery of the topics covered in RStudio for Six Sigma - Basic Descriptive Statistics with these activities:
Follow RStudio Tutorials
Following guided tutorials on using RStudio will help you to become familiar with the interface and how to perform basic data analysis operations.
Browse courses on RStudio
Show steps
  • Visit the RStudio website and find the tutorials section.
  • Choose a tutorial that covers a topic that you are interested in.
  • Follow the instructions in the tutorial.
Review Six Sigma Handbook
Reviewing the official handbook for Six Sigma will help you fully understand the concepts and principles covered in this course.
Show steps
  • Read the Introduction and Chapter 1.
  • Complete the exercises at the end of Chapter 1.
Join a Study Group
Joining a study group will allow you to connect with other students and work together to learn about Six Sigma.
Browse courses on Six Sigma
Show steps
  • Ask your instructor or classmates if they know of any existing study groups.
  • If there are no existing study groups, consider starting your own group.
  • Meet regularly and discuss the course material.
Four other activities
Expand to see all activities and additional details
Show all seven activities
Solve Six Sigma Practice Problems
Regularly working through practice problems on descriptive statistics and process analysis will help you develop a strong understanding of how this method is applied in the real world.
Browse courses on Descriptive Statistics
Show steps
  • Find a reputable source of Six Sigma practice problems, such as ASQ or iSixSigma.
  • Set aside 30 minutes each day to work through problems.
Create a Data Visualization
Creating a data visualization will help you to understand how to present data in a clear and concise way, which is an important skill in Six Sigma.
Browse courses on Data Visualization
Show steps
  • Choose a dataset that you are interested in.
  • Use RStudio to explore the data and identify patterns.
  • Create a data visualization that represents the data in a visually appealing way.
Participate in a Six Sigma Competition
Participating in a Six Sigma competition will give you an opportunity to apply your skills and knowledge in a real-world setting.
Browse courses on Six Sigma
Show steps
  • Find a Six Sigma competition that is open to students.
  • Form a team or work individually.
  • Develop a solution to the problem that is posed by the competition.
Volunteer for a Six Sigma Project
Volunteering for a Six Sigma project will allow you to apply your skills and knowledge to a real-world project and make a difference in your community.
Browse courses on Six Sigma
Show steps
  • Contact local organizations and businesses to see if they have any Six Sigma projects that you could volunteer for.
  • Interview with the organization or business to learn more about the project.
  • Work with the organization or business to complete the project.

Career center

Learners who complete RStudio for Six Sigma - Basic Descriptive Statistics will develop knowledge and skills that may be useful to these careers:
Statistician
A Statistician collects, analyzes, and interprets data to provide insights and solve problems. This course in RStudio for Six Sigma - Basic Descriptive Statistics provides a strong foundation in statistical methods and data analysis, which are essential for success in this role. The course covers topics such as data cleaning, data visualization, and statistical analysis, all of which are critical skills for Statisticians.
Data Scientist
A Data Scientist uses mathematical and analytical techniques to solve problems in business and industry. This course in RStudio for Six Sigma - Basic Descriptive Statistics provides a foundation in statistical methods and data analysis, which are essential for success in this role. The course covers topics such as data cleaning, data visualization, and statistical analysis, all of which are critical skills for Data Scientists.
Data Analyst
A Data Analyst is a professional who gathers, analyzes, and interprets data to provide insights and solve problems. This course in RStudio for Six Sigma - Basic Descriptive Statistics provides a strong foundation in data analysis, which is essential for success in this role. The course covers topics such as data cleaning, data visualization, and statistical analysis, all of which are critical skills for Data Analysts.
Machine Learning Engineer
A Machine Learning Engineer designs and develops machine learning models to solve problems in business and industry. This course in RStudio for Six Sigma - Basic Descriptive Statistics provides a foundation in statistical methods and data analysis, which are essential for success in this role. The course covers topics such as data cleaning, data visualization, and statistical analysis, all of which are critical skills for Machine Learning Engineers.
Actuary
An Actuary analyzes financial and statistical data to assess risk and make informed decisions. This course in RStudio for Six Sigma - Basic Descriptive Statistics provides a foundation in statistical methods and data analysis, which are essential for success in this role. The course covers topics such as data cleaning, data visualization, and statistical analysis, all of which are critical skills for Actuaries.
Business Analyst
A Business Analyst identifies and analyzes business needs and opportunities, and develops solutions to improve business performance. This course in RStudio for Six Sigma - Basic Descriptive Statistics provides a foundation in data analysis and statistical methods, which are essential for success in this role. The course covers topics such as data cleaning, data visualization, and statistical analysis, all of which are critical skills for Business Analysts.
Biostatistician
A Biostatistician applies statistical methods to solve problems in biology and medicine. This course in RStudio for Six Sigma - Basic Descriptive Statistics provides a foundation in statistical methods and data analysis, which are essential for success in this role. The course covers topics such as data cleaning, data visualization, and statistical analysis, all of which are critical skills for Biostatisticians.
Research Analyst
A Research Analyst analyzes data to provide insights and make informed decisions. This course in RStudio for Six Sigma - Basic Descriptive Statistics provides a foundation in data analysis and statistical methods, which are essential for success in this role. The course covers topics such as data cleaning, data visualization, and statistical analysis, all of which are critical skills for Research Analysts.
Quality Engineer
A Quality Engineer is responsible for improving the quality of products and services. This course in RStudio for Six Sigma - Basic Descriptive Statistics provides a foundation in statistical methods and data analysis, which are essential for success in this role. The course covers topics such as data cleaning, data visualization, and statistical analysis, all of which are critical skills for Quality Engineers.
Operations Research Analyst
An Operations Research Analyst uses mathematical and analytical techniques to solve problems in business and industry. This course in RStudio for Six Sigma - Basic Descriptive Statistics provides a foundation in statistical methods and data analysis, which are essential for success in this role. The course covers topics such as data cleaning, data visualization, and statistical analysis, all of which are critical skills for Operations Research Analysts.
Financial Analyst
A Financial Analyst analyzes financial data to provide insights and make investment recommendations. This course in RStudio for Six Sigma - Basic Descriptive Statistics provides a foundation in data analysis and statistical methods, which are essential for success in this role. The course covers topics such as data cleaning, data visualization, and statistical analysis, all of which are critical skills for Financial Analysts.
Market Research Analyst
A Market Research Analyst conducts research to understand consumer behavior and market trends. This course in RStudio for Six Sigma - Basic Descriptive Statistics provides a foundation in data analysis and statistical methods, which are essential for success in this role. The course covers topics such as data cleaning, data visualization, and statistical analysis, all of which are critical skills for Market Research Analysts.
Epidemiologist
An Epidemiologist investigates the causes and distribution of disease in populations. This course in RStudio for Six Sigma - Basic Descriptive Statistics provides a foundation in data analysis and statistical methods, which are essential for success in this role. The course covers topics such as data cleaning, data visualization, and statistical analysis, all of which are critical skills for Epidemiologists.
Data Visualization Engineer
A Data Visualization Engineer designs and develops data visualizations to communicate data insights effectively. This course in RStudio for Six Sigma - Basic Descriptive Statistics provides a foundation in data analysis and statistical methods, which are essential for success in this role. The course covers topics such as data cleaning, data visualization, and statistical analysis, all of which are critical skills for Data Visualization Engineers.
Software Engineer
A Software Engineer designs, develops, and maintains software applications. This course in RStudio for Six Sigma - Basic Descriptive Statistics provides a foundation in data analysis and statistical methods, which are becoming increasingly important in software development. The course covers topics such as data cleaning, data visualization, and statistical analysis, all of which are critical skills for Software Engineers.

Reading list

We've selected 14 books that we think will supplement your learning. Use these to develop background knowledge, enrich your coursework, and gain a deeper understanding of the topics covered in RStudio for Six Sigma - Basic Descriptive Statistics.
Provides a comprehensive overview of Six Sigma methodologies and tools. It valuable resource for anyone new to Six Sigma or for those who want to refresh their knowledge.
Handy reference guide for Six Sigma practitioners. It provides quick access to the most important tools and techniques.
Is the definitive guide to Six Sigma. It provides a comprehensive overview of the Six Sigma methodology, tools, and techniques.
Provides a comprehensive overview of the Six Sigma Black Belt certification process. It would be a valuable resource for students who are preparing for the Black Belt exam.
Provides a comprehensive overview of the R programming language. It would be a valuable resource for students who want to learn more about R, which popular programming language used in Six Sigma.
Provides a comprehensive overview of R for data science. It would be a valuable resource for students who want to learn more about using R for data analysis and visualization.
Provides a comprehensive overview of the ggplot2 package for data visualization in R. It would be a valuable resource for students who want to learn more about creating beautiful and informative data visualizations.
Provides a comprehensive overview of the dplyr package for data manipulation in R. It would be a valuable resource for students who want to learn more about using R for data cleaning and preparation.
Provides a comprehensive overview of probability and statistics for engineers and scientists. It would be a valuable resource for students who want to learn more about the mathematical foundations of statistics.
Provides a comprehensive overview of statistical inference. It would be a valuable resource for students who want to learn more about the mathematical foundations of statistics.
Provides a comprehensive overview of Bayesian data analysis. It would be a valuable resource for students who want to learn more about Bayesian statistics.

Share

Help others find this course page by sharing it with your friends and followers:

Similar courses

Similar courses are unavailable at this time. Please try again later.
Our mission

OpenCourser helps millions of learners each year. People visit us to learn workspace skills, ace their exams, and nurture their curiosity.

Our extensive catalog contains over 50,000 courses and twice as many books. Browse by search, by topic, or even by career interests. We'll match you to the right resources quickly.

Find this site helpful? Tell a friend about us.

Affiliate disclosure

We're supported by our community of learners. When you purchase or subscribe to courses and programs or purchase books, we may earn a commission from our partners.

Your purchases help us maintain our catalog and keep our servers humming without ads.

Thank you for supporting OpenCourser.

© 2016 - 2025 OpenCourser