We may earn an affiliate commission when you visit our partners.
Course image
Daria Toropchyn
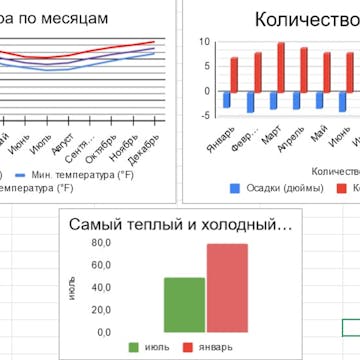
Вас когда-либо просили составить наглядный отчет на основе огромного количества данных, а вы не знали с чего начать? По окончании данного проекта вы научитесь использовать Google Таблицу для экспорта данных, а также для создания общего отчета с...
Read more
Вас когда-либо просили составить наглядный отчет на основе огромного количества данных, а вы не знали с чего начать? По окончании данного проекта вы научитесь использовать Google Таблицу для экспорта данных, а также для создания общего отчета с информативными диаграммами, которые вы сможете представить своей аудитории. Затем данный отчет может использоваться при принятии решения на основе этих данных. Примечание: этот курс изначально создан для учащихся из Северной Америки. На данный момент мы адаптируем его и для других регионов.
Enroll now

Good to know

Know what's good
, what to watch for
, and possible dealbreakers
Provides a practical approach to data visualization and analysis using Google Sheets
Helps learners develop data literacy, a valuable skill in today's data-driven society
Taught by industry experts, ensuring relevance and quality of content
Provides step-by-step instructions, making it accessible to learners with various backgrounds
Focuses on data visualization techniques that are widely used in business and academic settings

Save this course

Save Наглядное представление данных с помощью Google Таблицы to your list so you can find it easily later:
Save

Activities

Be better prepared before your course. Deepen your understanding during and after it. Supplement your coursework and achieve mastery of the topics covered in Наглядное представление данных с помощью Google Таблицы with these activities:
Review spreadsheet skills
Sharpen your spreadsheet skills to prepare for using Google Sheets in this course.
Browse courses on Spreadsheets
Show steps
  • Go through an online spreadsheet tutorial
  • Create a sample spreadsheet with formulas and charts
Organize your notes and assignments
Organize your notes and assignments to make it easier to review and retain the material covered in this course.
Show steps
  • Create a system for organizing your notes and assignments
  • Regularly review and update your notes
Create a data dictionary
Create a data dictionary to document the structure and meaning of the data you will be using in this course.
Show steps
  • Review the data you have access to
  • Identify the key attributes of each data element
  • Write clear and concise definitions for each attribute
Four other activities
Expand to see all activities and additional details
Show all seven activities
Watch tutorials on data visualization best practices
Watch tutorials on data visualization best practices to improve the quality and effectiveness of your visualizations.
Show steps
  • Search for tutorials on data visualization best practices
  • Watch the tutorials and take notes on the key principles
  • Apply the principles to your own data visualization projects
Design a dashboard
Design a dashboard to visualize the data you will be working with in this course.
Show steps
  • Identify the key metrics to track
  • Choose a visualization tool and create a data connection
  • Design the layout and add widgets to display the metrics
Practice creating charts and graphs
Practice creating charts and graphs to improve your data visualization skills.
Show steps
  • Choose a dataset and identify the key trends
  • Select the appropriate chart or graph type to visualize the data
  • Create the chart or graph using a spreadsheet or visualization tool
Present your dashboard
Present your dashboard to your classmates or a wider audience to showcase your data visualization skills and insights.
Show steps
  • Prepare a presentation that explains the purpose of your dashboard and the key insights you have gained
  • Practice your presentation to ensure it is clear and engaging
  • Deliver your presentation confidently and answer questions from the audience

Career center

Learners who complete Наглядное представление данных с помощью Google Таблицы will develop knowledge and skills that may be useful to these careers:
Management Consultant
Management Consultants use data visualization to help businesses make better decisions about their operations. This course can help you build a foundation in data visualization, which is a core skill for Management Consultants. It can also help you learn how to use Google Sheets, which is a popular tool for data visualization.
Data Scientist
Data Scientists use data visualization to help businesses make better decisions about their data. This course can help you build a foundation in data visualization, which is a core skill for Data Scientists. It can also help you learn how to use Google Sheets, which is a popular tool for data visualization.
Operations Research Analyst
Operations Research Analysts use data visualization to help businesses make better decisions about their operations. This course can help you build a foundation in data visualization, which is a core skill for Operations Research Analysts. It can also help you learn how to use Google Sheets, which is a popular tool for data visualization.
Statistician
Statisticians use data visualization to help businesses understand their data and make better decisions. This course can help you build a foundation in data visualization, which is a core skill for Statisticians. It can also help you learn how to use Google Sheets, which is a popular tool for data visualization.
Data Analyst
Data Analysts use their knowledge of data visualization, such as what this course teaches, to make sense of large datasets. They use their skills to provide insights that help businesses make better decisions. This course can help you build a foundation in data visualization, which is a core skill for Data Analysts. It can also help you learn how to use Google Sheets, which is a popular tool for data visualization.
Financial Analyst
Financial Analysts use data visualization to help businesses make better decisions about their finances. This course can help you build a foundation in data visualization, which is a core skill for Financial Analysts. It can also help you learn how to use Google Sheets, which is a popular tool for data visualization.
Product Manager
Product Managers use data visualization to help businesses make better decisions about their products. This course can help you build a foundation in data visualization, which is a core skill for Product Managers. It can also help you learn how to use Google Sheets, which is a popular tool for data visualization.
Data Visualization Specialist
Data Visualization Specialists use their knowledge of data visualization to help businesses make better decisions. This course can help you build a foundation in data visualization, which is a core skill for Data Visualization Specialists. It can also help you learn how to use Google Sheets, which is a popular tool for data visualization.
Business Intelligence Analyst
Business Intelligence Analysts use data visualization to help businesses understand their data and make better decisions. This course can help you build a foundation in data visualization, which is a core skill for Business Intelligence Analysts. It can also help you learn how to use Google Sheets, which is a popular tool for data visualization.
UX Designer
UX Designers use data visualization to help businesses make better decisions about their user experience. This course can help you build a foundation in data visualization, which is a core skill for UX Designers. It can also help you learn how to use Google Sheets, which is a popular tool for data visualization.
Graphic designer
Graphic Designers use data visualization to help businesses make better decisions about their designs. This course can help you build a foundation in data visualization, which is a core skill for Graphic Designers. It can also help you learn how to use Google Sheets, which is a popular tool for data visualization.
Market Researcher
Market Researchers use data visualization to help businesses understand their customers and make better decisions. This course can help you build a foundation in data visualization, which is a core skill for Market Researchers. It can also help you learn how to use Google Sheets, which is a popular tool for data visualization.
Web Designer
Web Designers use data visualization to help businesses make better decisions about their websites. This course can help you build a foundation in data visualization, which is a core skill for Web Designers. It can also help you learn how to use Google Sheets, which is a popular tool for data visualization.
Information Architect
Information Architects use data visualization to help businesses make better decisions about their information architecture. This course can help you build a foundation in data visualization, which is a core skill for Information Architects. It can also help you learn how to use Google Sheets, which is a popular tool for data visualization.
User Experience Researcher
User Experience Researchers use data visualization to help businesses make better decisions about their user experience. This course can help you build a foundation in data visualization, which is a core skill for User Experience Researchers. It can also help you learn how to use Google Sheets, which is a popular tool for data visualization.

Reading list

We've selected 12 books that we think will supplement your learning. Use these to develop background knowledge, enrich your coursework, and gain a deeper understanding of the topics covered in Наглядное представление данных с помощью Google Таблицы.
This classic book on data visualization provides a comprehensive overview of the principles and techniques of effective visual communication. It valuable resource for anyone who wants to learn more about the history and theory of data visualization.
Provides a comprehensive overview of data visualization techniques, covering topics such as data exploration, chart design, and storytelling. It valuable resource for anyone who wants to learn more about the art and science of data visualization.
Provides a framework for choosing the right chart type for different types of data. It can help learners understand the principles of effective data visualization and create more impactful charts.
Provides a comprehensive guide to using ggplot2, a popular R package for data visualization. It covers topics such as data manipulation, chart creation, and statistical modeling. It valuable resource for anyone who wants to learn more about using ggplot2 for data visualization.
Provides a practical guide to designing and building effective dashboards. It covers topics such as data selection, chart selection, and dashboard layout. It valuable resource for anyone who wants to learn more about creating dashboards that communicate insights effectively.
Provides a practical introduction to data visualization, covering topics such as data preparation, chart design, and best practices. It can help learners develop a solid foundation in data visualization.
Provides a practical guide to data visualization using Python and JavaScript. It covers topics such as data manipulation, chart creation, and interactive dashboards. It valuable resource for anyone who wants to learn more about using these tools for data visualization.
Provides a practical guide to data visualization, covering topics such as data cleaning, chart selection, and design principles. It good resource for learners who want to quickly get up to speed with data visualization.
Provides a practical guide to creating interactive data visualizations for the web. It covers topics such as data manipulation, chart creation, and user interaction. It valuable resource for anyone who wants to learn more about using web technologies for data visualization.
Provides a collection of recipes for creating different types of charts and graphs in R. It valuable resource for anyone who wants to learn more about using R for data visualization.
Provides a comprehensive guide to creating charts in Microsoft Excel. It covers topics such as chart types, formatting, and customization. It valuable resource for anyone who wants to learn more about using Excel for data visualization.

Share

Help others find this course page by sharing it with your friends and followers:

Similar courses

Here are nine courses similar to Наглядное представление данных с помощью Google Таблицы.
Расчет бюджета на покупку жилья в Google Таблице
Most relevant
Создание бюджета в Google Таблице
Most relevant
Основы машинного обучения
Most relevant
Анализ данных с использованием Python
Most relevant
Python: обработка и анализ данных и ИИ
Most relevant
Наглядно представляем данные в Microsoft Excel
Most relevant
Принятие решений в маркетинге на основе анализа данных
Most relevant
Программирование на Python для анализа данных
Most relevant
Политика и управление водными ресурсами
Most relevant
Our mission

OpenCourser helps millions of learners each year. People visit us to learn workspace skills, ace their exams, and nurture their curiosity.

Our extensive catalog contains over 50,000 courses and twice as many books. Browse by search, by topic, or even by career interests. We'll match you to the right resources quickly.

Find this site helpful? Tell a friend about us.

Affiliate disclosure

We're supported by our community of learners. When you purchase or subscribe to courses and programs or purchase books, we may earn a commission from our partners.

Your purchases help us maintain our catalog and keep our servers humming without ads.

Thank you for supporting OpenCourser.

© 2016 - 2024 OpenCourser