Linear Regression
vigating the Landscape of Linear Regression
Linear regression is a foundational statistical method used to model the relationship between a dependent variable and one or more independent variables by fitting a linear equation to observed data. At its core, it seeks to find the straight line that best represents the connections within a dataset, allowing for predictions and the understanding of how changes in independent variables impact the dependent variable. This technique is a cornerstone of data analysis, providing a straightforward yet powerful way to uncover trends and make forecasts.
Working with linear regression can be quite engaging. It offers the intellectual challenge of dissecting complex datasets to unearth meaningful relationships. Furthermore, the ability to predict future outcomes based on these relationships provides a tangible sense of impact, whether in forecasting economic trends, assessing risks in healthcare, or optimizing marketing strategies. The versatility of linear regression across numerous disciplines means that practitioners are often involved in diverse and impactful projects.
What is Linear Regression?
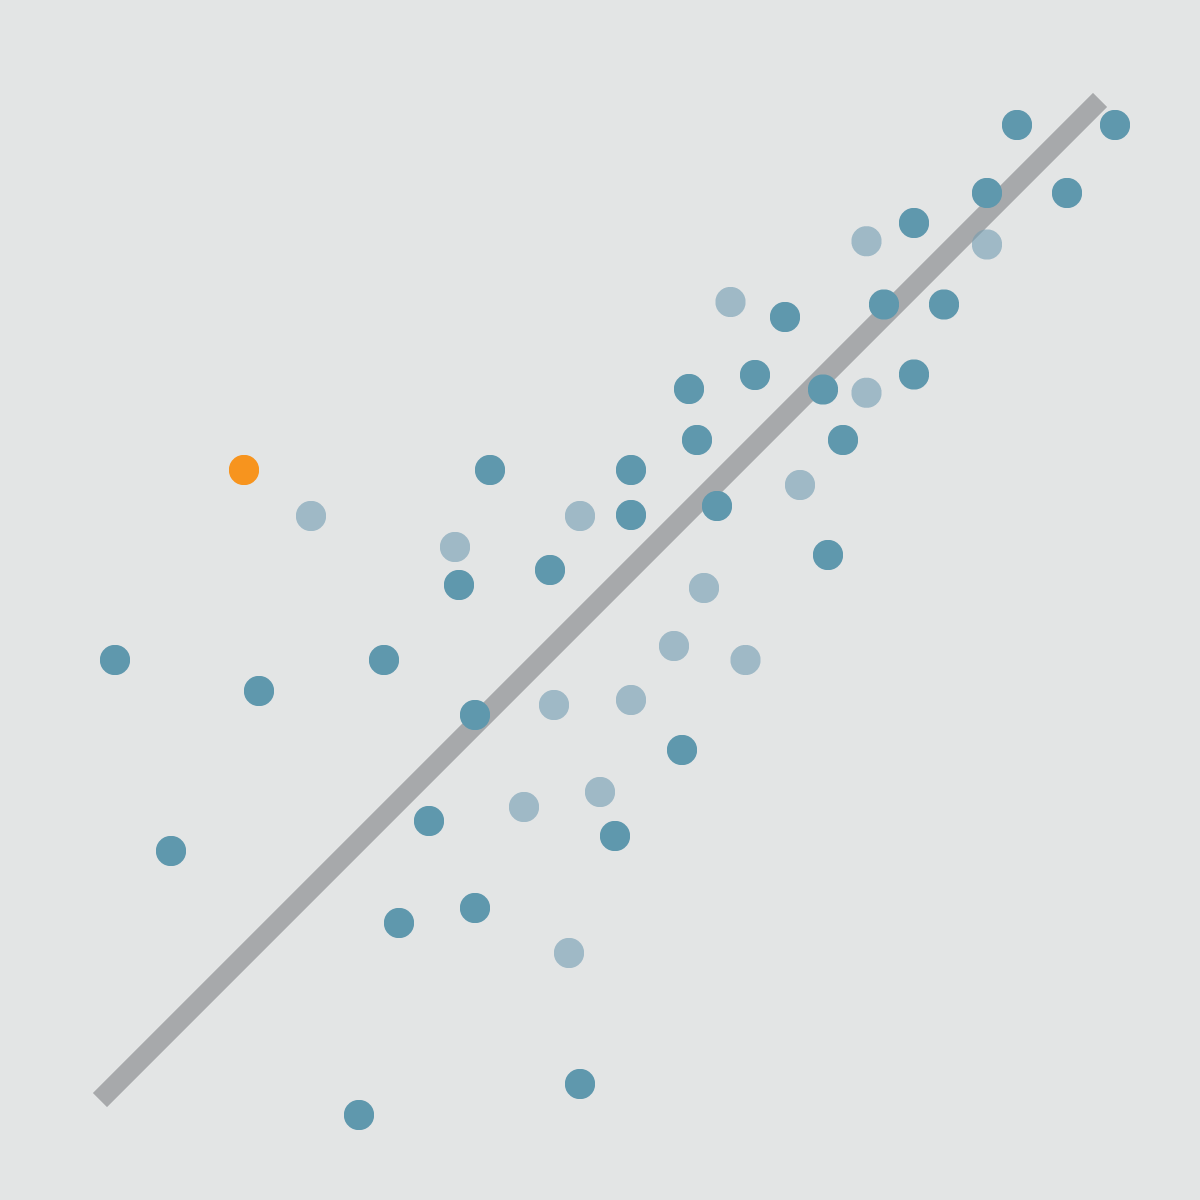
Linear regression is a statistical technique that examines the linear relationship between a dependent variable and one or more independent variables. Think of it as finding the best-fitting straight line through a scatter of data points. This line then helps us understand how the independent variable(s) influence the dependent variable and allows us to make predictions. It's a fundamental concept in both statistics and machine learning, often serving as a starting point for more complex analyses.
The Core Idea: Finding the "Best Fit" Line
Imagine you have a collection of data points on a graph. For instance, you might have data showing the number of hours students studied and the exam scores they received. Linear regression attempts to draw a single straight line through these points that best represents the overall trend. This "best fit" line isn't necessarily going to pass through every single point, but it will be the line that minimizes the total distance from all the points to the line. Once this line is established, you can use it to predict, for example, what score a student might get if they study for a certain number of hours.
The equation of this line is typically in the form Y = mX + c, where Y is the dependent variable (what you're trying to predict, like exam scores), X is the independent variable (what you're using to make the prediction, like hours studied), m is the slope of the line (how much Y changes for a one-unit change in X), and c is the y-intercept (the value of Y when X is zero). When there's only one independent variable, it's called simple linear regression. If there are multiple independent variables (e.g., hours studied and previous grades to predict exam score), it's known as multiple linear regression.
A Brief Look Back: Historical Development
The foundational concepts of linear regression can be traced back to the late 19th century, with significant contributions from statisticians like Sir Francis Galton. Galton, while studying heredity, observed that the heights of children tended to "regress" towards the mean height of the population compared to their parents' heights. This observation laid some of the initial groundwork. Over time, mathematicians and statisticians like Karl Pearson further developed these ideas, leading to the formalization of the methods we use today. The advent of computers dramatically accelerated the application and complexity of regression analyses, making it possible to analyze large datasets and perform complex calculations that were previously impractical.
Simple vs. Multiple Linear Regression
The distinction between simple and multiple linear regression lies in the number of independent variables used to predict the dependent variable.
Simple Linear Regression involves a single independent variable. For example, predicting a person's weight (dependent variable) based solely on their height (independent variable). The goal is to find the linear relationship between these two variables.
Multiple Linear Regression, on the other hand, uses two or more independent variables to predict the dependent variable. For instance, predicting a house price (dependent variable) might involve considering its size, number of bedrooms, location, and age (all independent variables). This allows for a more nuanced understanding of how various factors collectively influence the outcome.
These foundational courses can help you build a strong understanding of both simple and multiple linear regression.
You may also wish to explore these topics for a broader understanding of the statistical context in which linear regression resides.
Common Applications Across Diverse Fields
Linear regression's versatility makes it a valuable tool in a wide array of disciplines. In business and economics, it's frequently used for forecasting sales, understanding consumer behavior, and assessing the impact of advertising. Financial analysts employ it to model asset prices and understand risk.
In healthcare and medicine, linear regression helps in predicting patient outcomes, analyzing the effectiveness of treatments, and identifying risk factors for diseases. For example, it can be used to model the relationship between dosage levels of a drug and a patient's blood pressure.
Social sciences utilize linear regression to study relationships between variables like education level and income, or crime rates and socioeconomic factors. In engineering and manufacturing, it's applied for quality control, predicting equipment failure, and optimizing processes. Even in environmental science, it can be used to model the impact of pollutants on ecosystems.
These courses showcase some of the diverse applications of linear regression:
Mathematical Foundations of Linear Regression
To truly grasp linear regression, a dive into its mathematical underpinnings is necessary. This involves understanding the equation that defines the relationship, the assumptions that must hold for the model to be valid, the method used to find the "best fit" line, and how we measure the model's performance.
The Linear Regression Equation and Interpreting Its Parameters
As mentioned earlier, the basic equation for a simple linear regression model is Y = β₀ + β₁X + ε.
- Y is the dependent variable (the outcome you are trying to predict).
- X is the independent variable (the predictor).
- β₀ (beta-naught) is the y-intercept. This is the predicted value of Y when X is equal to 0. Its interpretation needs to be contextually relevant; sometimes X=0 is not a meaningful value.
- β₁ (beta-one) is the slope coefficient. This represents the change in the predicted value of Y for a one-unit increase in X. It quantifies the strength and direction of the relationship between X and Y. A positive β₁ indicates a positive relationship (as X increases, Y increases), while a negative β₁ indicates a negative relationship (as X increases, Y decreases).
- ε (epsilon) is the error term. This accounts for the variability in Y that cannot be explained by the linear relationship with X. It represents the difference between the observed values of Y and the values predicted by the model.
In multiple linear regression, the equation expands to include more independent variables: Y = β₀ + β₁X₁ + β₂X₂ + ... + βₚXₚ + ε, where each X represents a different independent variable, and each β represents its corresponding coefficient. Each β coefficient (β₁, β₂, ..., βₚ) indicates the change in Y for a one-unit change in that specific X, assuming all other X variables are held constant.
Understanding these parameters is crucial for interpreting the model's output and drawing meaningful conclusions about the relationships within the data.
Key Assumptions of Linear Regression
For the results of a linear regression model to be reliable and valid, several key assumptions about the data and the model must be met. Violating these assumptions can lead to misleading or incorrect conclusions.
- Linearity: The relationship between the independent variable(s) and the dependent variable is assumed to be linear. If the true relationship is non-linear, a linear model will not accurately capture it. Scatter plots of the data can often help visually assess this assumption.
- Independence of Errors: The error terms (ε) are assumed to be independent of each other. This means that the error for one observation does not influence the error for another observation. This is particularly important for time-series data where errors can be correlated over time (autocorrelation).
- Homoscedasticity (Constant Variance): The variance of the error terms is assumed to be constant across all levels of the independent variable(s). In other words, the spread of the residuals (the differences between observed and predicted values) should be roughly the same for all predicted values. Heteroscedasticity (non-constant variance) can lead to inefficient and biased estimates of the standard errors, affecting hypothesis tests and confidence intervals.
- Normality of Errors: The error terms are assumed to be normally distributed, especially for smaller sample sizes. This assumption is important for hypothesis testing and constructing confidence intervals for the coefficients. For larger sample sizes, the central limit theorem often ensures that the coefficient estimates are approximately normally distributed even if the errors themselves are not.
- No Perfect Multicollinearity (for multiple linear regression): In multiple linear regression, the independent variables should not be perfectly correlated with each other. Perfect multicollinearity makes it impossible to estimate the individual coefficients. High (but not perfect) multicollinearity can also be problematic, leading to unstable and imprecise coefficient estimates.
These courses delve deeper into the mathematical and statistical assumptions underpinning regression models.
For those looking for a comprehensive text on the subject, these books are highly recommended.
The Ordinary Least Squares (OLS) Method
The most common method used to estimate the β coefficients (the intercept and slopes) in a linear regression model is the Ordinary Least Squares (OLS) method. The OLS method aims to find the line (or hyperplane in multiple regression) that minimizes the sum of the squared differences between the observed values of the dependent variable (Y) and the values predicted by the linear model (Ŷ, pronounced Y-hat).
Mathematically, OLS seeks to minimize Σ(Yᵢ - Ŷᵢ)², where Yᵢ is the observed value for the i-th observation and Ŷᵢ is the predicted value for the i-th observation. Squaring the differences ensures that positive and negative deviations don't cancel each other out and also penalizes larger deviations more heavily. Through calculus (specifically, by taking partial derivatives with respect to each β coefficient and setting them to zero), a set of equations can be derived that, when solved, provide the OLS estimates for β₀ and β₁ (and any other β coefficients in multiple regression).
OLS is popular because it is relatively simple to compute and, under the assumptions of linear regression (particularly the first four, known as the Gauss-Markov assumptions), it provides the Best Linear Unbiased Estimators (BLUE). This means that among all linear unbiased estimators, OLS estimators have the smallest variance.
Measuring How Well the Model Fits: Goodness-of-Fit
Once a linear regression model has been fitted to the data, it's crucial to assess how well it actually represents the data. This is known as assessing the "goodness-of-fit." Several metrics are commonly used for this purpose.
R-squared (R²): R-squared, also known as the coefficient of determination, measures the proportion of the variance in the dependent variable that is predictable from the independent variable(s). It ranges from 0 to 1 (or 0% to 100%). An R² of 0 means the model explains none of the variability of the response data around its mean, while an R² of 1 means the model explains all the variability. A higher R² generally indicates a better fit, but it's not the only consideration. Adding more independent variables to a model will almost always increase R², even if those variables are not truly predictive. This is where adjusted R-squared comes in.
Adjusted R-squared: Adjusted R-squared is a modified version of R-squared that adjusts for the number of predictors in the model. Unlike R-squared, adjusted R-squared can decrease if a new predictor improves the model by less than would be expected by chance. It is generally considered a more reliable indicator of model fit when comparing models with different numbers of independent variables.
Other metrics and diagnostic tools, such as the F-statistic (for testing the overall significance of the model), t-statistics (for testing the significance of individual coefficients), and residual plots (for visually checking assumptions), are also vital components of evaluating a linear regression model.
Applications in Industry and Research
Linear regression is not just a theoretical concept; it's a workhorse in countless real-world applications across various industries and research domains. Its ability to model relationships and make predictions makes it invaluable for decision-making and discovery.
Predictive Analytics in Finance and Economics
In the realms of finance and economics, linear regression is extensively used for predictive analytics. Financial analysts might use it to forecast stock prices, assess the risk of investments, or model the relationship between interest rates and bond yields. For example, the Capital Asset Pricing Model (CAPM), a cornerstone of modern finance, uses linear regression to estimate the expected return of an asset based on its systematic risk (beta). Banks and lending institutions use regression models for credit scoring, predicting the likelihood of loan defaults based on applicant characteristics.
Economists apply linear regression to understand relationships between macroeconomic variables like GDP growth, inflation, unemployment, and interest rates. It can be used to forecast economic trends, evaluate the impact of government policies, or analyze consumer spending patterns. For instance, a company might use regression to predict demand for its products based on economic indicators and marketing expenditures.
These courses demonstrate the application of linear regression in financial and economic contexts:
For those interested in the broader field, these topics provide further context:
Risk Assessment in Healthcare and Insurance
The healthcare and insurance industries rely heavily on linear regression for risk assessment. In healthcare, predictive models built using regression can help identify patients at high risk for certain diseases or conditions, allowing for early intervention and personalized treatment plans. For example, a model might predict a patient's risk of developing heart disease based on factors like age, blood pressure, cholesterol levels, and smoking habits. Hospitals also use regression to predict patient readmission rates or length of stay, aiding in resource allocation.
Insurance companies use linear regression to set premium prices and manage risk. By analyzing historical data, they can model the relationship between various risk factors (e.g., age, driving record, location for auto insurance; or age, health status, lifestyle for life insurance) and the likelihood or cost of claims. This allows them to charge premiums that accurately reflect the risk profile of the insured.
Consider these courses for insights into healthcare applications:
This book provides a deeper dive into regression analysis, which is fundamental to risk assessment.
Optimizing Marketing ROI
In the field of marketing, linear regression is a key tool for optimizing Return on Investment (ROI). Marketers use regression models to understand how different marketing activities (e.g., advertising spend on various channels, promotional offers, social media engagement) impact sales or customer acquisition. By quantifying these relationships, businesses can make more informed decisions about how to allocate their marketing budgets to achieve the best results.
For example, a company could use multiple linear regression to model sales as a function of spending on TV ads, radio ads, and online ads. The coefficients from the model would indicate the expected increase in sales for each additional dollar spent on each channel, helping to identify the most effective advertising avenues. Regression can also be used for customer segmentation, pricing strategy optimization, and forecasting market share.
The following courses explore the use of regression in a marketing context:
Academic Case Studies Across Social and Hard Sciences
Linear regression is a staple in academic research across both social sciences (like psychology, sociology, political science) and hard sciences (like biology, chemistry, physics, and environmental science). Researchers use it to test hypotheses, explore relationships between variables, and build predictive models based on empirical data.
In psychology, a researcher might use linear regression to investigate the relationship between hours of sleep and cognitive performance. In sociology, it could be used to analyze the factors influencing educational attainment or social mobility. Political scientists might use it to model voting behavior based on demographic factors and political ideology. In environmental science, regression models can assess the impact of pollution levels on biodiversity or predict changes in climate patterns. The interpretability of linear regression models makes them particularly useful for communicating research findings.
This book provides examples of regression applications in the social sciences.
Career Pathways Using Linear Regression
A strong understanding of linear regression and its applications can open doors to a variety of career paths, particularly in fields that rely on data analysis and interpretation. As organizations increasingly seek to make data-driven decisions, professionals skilled in statistical modeling techniques like linear regression are in high demand.
Embarking on a career that utilizes linear regression can be a rewarding journey. For those new to the field or considering a pivot, it's natural to feel a mix of excitement and apprehension. The path may seem daunting, but every expert started as a beginner. With dedication and the right learning resources, building proficiency in this area is achievable. Remember that the skills you develop are not just abstract; they are highly sought after and can lead to impactful work across many sectors. Ground yourself in the fundamentals, practice consistently with real-world datasets, and don't be discouraged by challenges—they are part of the learning process. Your journey into data-driven careers is a marathon, not a sprint, and each step forward builds a stronger foundation.
Entry-Level Roles: Data Analyst and Business Intelligence Analyst
For individuals starting their careers or transitioning into data-focused roles, positions like Data Analyst or Business Intelligence (BI) Analyst often serve as excellent entry points. In these roles, linear regression is a common tool for tasks such as identifying trends in sales data, analyzing customer behavior, evaluating the effectiveness of marketing campaigns, or creating reports that provide insights to business stakeholders.
A Data Analyst typically collects, cleans, analyzes, and interprets data to help organizations make better decisions. They might use linear regression to forecast future values or understand the relationship between different business metrics. A BI Analyst focuses more on developing reporting systems, dashboards, and data visualizations that allow businesses to monitor performance and identify areas for improvement. Both roles require a good understanding of statistical concepts, data manipulation skills, and proficiency in tools like Excel, SQL, and often programming languages like Python or R.
The U.S. Bureau of Labor Statistics projects strong growth for data-related professions. For example, employment for data scientists is projected to grow 36 percent from 2023 to 2033, which is much faster than the average for all occupations. Similarly, roles for statisticians are also expected to see significant growth.
These courses can help you build foundational skills for these roles:
You might also find these career profiles informative:
Advanced Positions: Quantitative Researcher and Machine Learning Engineer
With more experience and advanced education (often a Master's or Ph.D.), individuals can move into more specialized and senior roles. A Quantitative Researcher (often found in finance, but also in other research-intensive fields) develops and implements complex mathematical and statistical models to solve problems, often involving large datasets. Linear regression and its extensions are fundamental tools in their toolkit for tasks like algorithmic trading, risk management, or economic forecasting.
A Machine Learning Engineer designs and builds production-ready machine learning systems. While they work with a broad range of algorithms, a deep understanding of linear regression is crucial as it forms the basis for many advanced techniques and is often used as a benchmark model. They focus on deploying, monitoring, and scaling machine learning models in real-world applications.
These roles typically require strong programming skills (Python and R are common), a deep understanding of statistical theory and machine learning algorithms, and experience with big data technologies.
For those aspiring to these advanced roles, these courses offer relevant knowledge:
Consider exploring these related careers:
Industry-Specific Demand: Finance vs. Tech and Beyond
The demand for skills in linear regression varies across industries, but it is prominent in both finance and technology. The finance industry has long relied on regression for risk modeling, asset valuation, and algorithmic trading. The tech industry heavily utilizes regression in areas like A/B testing, user behavior analysis, recommendation systems, and optimizing online advertising.
Beyond finance and tech, many other sectors have a strong need for professionals with regression skills. Healthcare uses it for clinical trial analysis and epidemiological studies. Marketing departments across all industries use it for campaign analysis and customer segmentation. Consulting firms frequently employ analysts who can apply regression techniques to solve client problems in diverse areas. Government agencies and research institutions also employ statisticians and data scientists with these skills. The Bureau of Labor Statistics highlights that employment growth for statisticians is expected due to the more widespread use of statistical analysis in business, healthcare, and policy decisions.
Skill Adjacency to Other Statistical Methods
Learning linear regression provides a strong foundation for understanding many other statistical methods and machine learning algorithms. It is often one of the first modeling techniques taught in statistics and data science programs because its concepts are relatively intuitive and broadly applicable.
Knowledge of linear regression is directly transferable to understanding:
- Logistic Regression: Used for classification problems (predicting a categorical outcome) rather than continuous values. It models the probability of an outcome.
- Generalized Linear Models (GLMs): An extension of linear regression that allows for response variables that have error distribution models other than a normal distribution (e.g., Poisson regression for count data, logistic regression for binary data).
- Time Series Analysis: Many time series models, like ARIMA, incorporate regression-like components to model trends and seasonality.
- ANOVA (Analysis of Variance) and ANCOVA (Analysis of Covariance): These are essentially special cases of linear regression used to compare means across different groups.
- More Complex Machine Learning Algorithms: Techniques like support vector machines, neural networks, and tree-based methods (like random forests and gradient boosting) often build upon or are compared against linear regression models. Understanding the assumptions and limitations of linear regression helps in appreciating why and when these more complex models are necessary.
This foundational knowledge makes it easier to learn and apply a wider array of analytical tools, enhancing career flexibility and problem-solving capabilities.
These courses cover related statistical methods:
You may also be interested in these related topics:
Formal Education Pathways
For those seeking a structured approach to mastering linear regression and its applications, formal education provides a comprehensive pathway. This typically involves a progression from foundational mathematics to specialized statistics and data science coursework at the undergraduate and graduate levels.
Prerequisite Mathematics: Algebra, Calculus, and Linear Algebra
A solid grounding in certain areas of mathematics is essential before diving deep into the theory and application of linear regression.
- Algebra: Fundamental algebraic concepts, including solving linear equations, understanding functions, and working with variables, are critical. Manipulating the regression equation and understanding its components rely heavily on algebra.
- Calculus: Differential calculus is particularly important for understanding how the Ordinary Least Squares (OLS) method works. OLS involves minimizing the sum of squared errors, which is an optimization problem solved using derivatives. Integral calculus can also appear in probability theory related to error distributions.
- Linear Algebra: As you move from simple to multiple linear regression, and into more advanced statistical modeling, linear algebra becomes indispensable. Concepts like vectors, matrices, matrix multiplication, and solving systems of linear equations are used to represent and solve regression problems efficiently, especially when dealing with many variables.
Building these mathematical foundations early on will significantly aid in comprehending the more advanced statistical concepts encountered later.
Undergraduate Coursework in Statistics
At the undergraduate level, students typically encounter linear regression in introductory and intermediate statistics courses. Core coursework often includes:
- Introduction to Statistics: Covers basic probability, descriptive statistics, sampling distributions, hypothesis testing, and an initial introduction to correlation and simple linear regression.
- Probability Theory: Provides a deeper understanding of probability distributions, random variables, expectation, variance, and covariance, which are all foundational to understanding the assumptions and properties of regression models.
- Mathematical Statistics: Delves into the theoretical underpinnings of statistical inference, estimation theory (including properties of estimators like OLS), and hypothesis testing in a more rigorous mathematical framework.
- Applied Regression Analysis: A dedicated course focusing on simple and multiple linear regression, model building, assumption checking (diagnostics), variable selection, and interpretation of results. This often includes hands-on experience with statistical software like R or Python.
These courses are often part of a statistics major or minor, or can be taken as electives by students in fields like economics, psychology, computer science, and engineering.
This comprehensive course covers statistical learning, including regression.
This book is a classic text in the field of statistical learning.
Graduate-Level Econometrics and Machine Learning Programs
For those wishing to specialize further or pursue research-oriented careers, graduate-level programs offer advanced training.
- Econometrics Programs: Often found within economics departments, these programs focus on the application of statistical methods to economic data. Linear regression is a cornerstone, and advanced topics include time series econometrics, panel data models, instrumental variables, and causal inference techniques.
- Statistics or Biostatistics Master's/Ph.D. Programs: These programs provide rigorous training in statistical theory and methodology. Advanced regression topics might include generalized linear models, mixed-effects models, non-parametric regression, Bayesian regression, and high-dimensional regression.
- Machine Learning or Data Science Programs: These interdisciplinary programs, often housed in computer science or statistics departments, cover a wide range of machine learning algorithms. Linear regression is taught as a fundamental supervised learning technique, and its relationship to other algorithms (like logistic regression, support vector machines, and neural networks) is explored. Emphasis is often placed on predictive performance, model validation, and computational aspects.
Graduate programs typically involve more in-depth theoretical work, research projects, and the use of advanced computational tools.
Consider these courses for an introduction to machine learning concepts:
This book provides a theoretical understanding of machine learning.
Research Opportunities in Applied Fields
Formal education, particularly at the graduate level, often opens doors to research opportunities where linear regression and its extensions are applied to solve real-world problems. These opportunities can exist within universities (e.g., working on research grants with professors), government agencies (e.g., statistical agencies, research labs), non-profit research organizations, and R&D departments in private industry.
Applied research fields are diverse and include areas like:
- Medical Research: Analyzing clinical trial data, epidemiological studies, genetics research.
- Public Policy: Evaluating the impact of social programs, economic policy analysis.
- Environmental Science: Modeling climate change, pollution effects, resource management.
- Market Research: Understanding consumer behavior, product development, advertising effectiveness.
- Finance: Developing trading strategies, risk management models, financial forecasting.
Engaging in research allows students and professionals to apply their knowledge of linear regression in meaningful ways, contribute to new discoveries, and develop specialized expertise. The ability to formulate research questions, design studies, apply appropriate regression techniques, and interpret results critically is highly valued.
This course provides a capstone project experience, often involving research-like activities.
Online and Self-Directed Learning
For those seeking flexibility, career pivots, or skills enhancement outside traditional academic structures, online courses and self-directed learning offer powerful avenues to master linear regression. The wealth of resources available allows learners to tailor their education to their specific needs and pace.
Taking the initiative for self-directed learning is commendable. It requires discipline and motivation, but the rewards in terms of skill acquisition and career flexibility can be immense. Remember that platforms like OpenCourser are designed to help you navigate the vast landscape of online courses, making it easier to find resources that fit your learning style and goals. Don't hesitate to supplement your learning with projects, join online communities for support, and continuously challenge yourself. The journey of self-improvement is ongoing, and every module completed or concept mastered is a step towards your professional aspirations.
Curriculum Components for Self-Study
A well-rounded self-study curriculum for linear regression should cover several key areas:
- Statistical Foundations: Begin with the basics of descriptive statistics, probability, and inferential statistics. Understanding concepts like mean, variance, standard deviation, probability distributions (especially the normal distribution), sampling, and hypothesis testing is crucial.
- Core Linear Regression Concepts: Study the definition of simple and multiple linear regression, the regression equation, interpretation of coefficients (slope and intercept), and the underlying assumptions (linearity, independence, homoscedasticity, normality).
- Mathematical Basis: Gain an understanding of the Ordinary Least Squares (OLS) method and how it's used to estimate model parameters. A basic grasp of the calculus and linear algebra involved can be very beneficial.
- Model Building and Evaluation: Learn about variable selection techniques, checking model assumptions (residual analysis), identifying and handling multicollinearity, and assessing goodness-of-fit (R-squared, adjusted R-squared, F-statistic, t-statistics).
- Software Implementation: Gain proficiency in at least one statistical software package or programming language commonly used for regression, such as R, Python (with libraries like StatsModels, Scikit-learn), or even Excel for simpler analyses.
- Extensions and Related Topics: Once comfortable with basic linear regression, explore related topics like logistic regression, polynomial regression, interaction terms, and perhaps an introduction to time series analysis or generalized linear models.
Online platforms offer a plethora of courses covering these components, often from renowned universities and industry experts. OpenCourser's extensive catalog, for instance, allows you to browse Data Science courses and find options that fit your learning objectives.
Here are some courses that are well-suited for self-study, covering different aspects of linear regression and its implementation:
Project-Based Learning Strategies
Theoretical knowledge is essential, but applying that knowledge through hands-on projects is where true understanding and skill develop. Project-based learning for linear regression involves:
- Finding Datasets: Seek out real-world or publicly available datasets that interest you. Sources like Kaggle, UCI Machine Learning Repository, government data portals (e.g., data.gov), or even data from your own work (if permissible) can be excellent starting points.
- Defining a Problem: Formulate a clear question you want to answer or a prediction you want to make using the dataset. For example, "Can I predict housing prices based on square footage and number of bedrooms?" or "What is the relationship between advertising spend and sales?"
- Data Cleaning and Preparation: This is often a significant part of any data analysis project. It involves handling missing values, transforming variables, and ensuring the data is in a suitable format for regression analysis.
- Model Building: Apply linear regression techniques to your data. Start with simple models and gradually add complexity if needed.
- Assumption Checking and Iteration: Critically evaluate whether your model meets the assumptions of linear regression. Use diagnostic plots and statistical tests. If assumptions are violated, you may need to transform variables, remove outliers (with justification), or consider alternative modeling approaches.
- Interpretation and Communication: Interpret your model's coefficients and goodness-of-fit statistics. Clearly communicate your findings, including any limitations of your analysis. Visualizations are key here.
Many online courses incorporate project-based assignments. For example, some courses guide you through predicting life expectancy or graduate admissions using regression techniques.
These project-based courses provide excellent hands-on experience:
Certifications and Portfolio Development
While not always a strict requirement, certifications from reputable online course providers or professional organizations can help validate your skills to potential employers, especially if you are self-taught or transitioning careers. Completing a series of courses in a specialization or a professional certificate program often culminates in a capstone project, which can be a significant portfolio piece.
Developing a portfolio of your data analysis projects is crucial. This portfolio should showcase:
- A variety of projects demonstrating different aspects of linear regression and data analysis.
- Clear problem statements and methodologies.
- Code (e.g., Python notebooks, R scripts), ideally hosted on platforms like GitHub.
- Clear interpretations and visualizations of your results.
- A narrative explaining your thought process, challenges faced, and how you overcame them.
A strong portfolio provides tangible evidence of your abilities and can be far more persuasive than a resume alone. Consider using OpenCourser's "Save to list" feature to curate courses that offer certificates or contribute to strong portfolio projects; you can manage your saved items at https://opencourser.com/list/manage.
For more guidance on leveraging online learning, the OpenCourser Learner's Guide offers articles on topics like how to earn certificates and add them to your professional profiles.
Complementing Formal Education with Online Resources
Online learning isn't just for those outside traditional academia; it's also an invaluable resource for students enrolled in formal degree programs and for working professionals looking to upskill.
- Supplementing Coursework: University courses may cover theory extensively but sometimes lack practical, hands-on coding exercises or exposure to the latest tools. Online courses can fill these gaps, offering tutorials on specific software (like Python libraries for regression) or project-based learning that complements theoretical lectures.
- Exploring Specializations: Formal programs may offer a broad overview. Online courses allow students and professionals to dive deeper into niche areas of interest, such as advanced regression techniques, time series analysis, or machine learning applications in a specific industry, that might not be covered in their primary curriculum.
- Staying Current: The fields of data science and machine learning are rapidly evolving. Online platforms often feature courses on cutting-edge topics and tools more quickly than traditional curricula can update.
- Skill Refreshers: Professionals who learned regression years ago can use online courses to refresh their knowledge and learn about new developments or software.
By strategically combining formal education with targeted online learning, individuals can create a more comprehensive and up-to-date skill set, making them more competitive and adaptable in the job market.
These books are excellent companions to both formal and self-directed learning paths:
Ethical Considerations in Linear Regression
While linear regression is a powerful analytical tool, its application is not without ethical implications. Practitioners must be mindful of how data is collected, how models are interpreted, and how their outputs might impact individuals and society. Responsible use of linear regression requires careful consideration of potential biases, privacy concerns, transparency, and regulatory compliance.
Bias in Data Collection and Model Interpretation
Bias can creep into linear regression models at various stages, leading to unfair or discriminatory outcomes.
- Data Collection Bias: If the data used to train a regression model is not representative of the population to which the model will be applied, the model may perform poorly or unfairly for certain subgroups. For example, if a credit scoring model is trained primarily on data from one demographic group, it may be less accurate or biased against other groups. Historical biases present in society can also be encoded in data, and models trained on such data can perpetuate or even amplify these biases.
- Feature Selection Bias: The choice of independent variables (features) included in the model can introduce bias. Excluding relevant variables or including variables that are proxies for sensitive attributes (like race or gender, even if those attributes themselves are excluded) can lead to biased outcomes.
- Interpretation Bias: Correlation does not imply causation. It's a common ethical pitfall to misinterpret regression results as indicating a causal relationship when the model only shows an association. Drawing incorrect causal inferences can lead to flawed decision-making with real-world consequences. Additionally, oversimplifying or misrepresenting the model's findings to stakeholders can be misleading.
Mitigating these biases requires careful attention to data sourcing, rigorous feature engineering, awareness of potential confounding variables, and cautious interpretation of results. The American Statistical Association provides ethical guidelines that emphasize the responsibility of practitioners to understand and mitigate biases.
Privacy Concerns with Sensitive Datasets
Linear regression models, especially those used in fields like healthcare, finance, or social sciences, often rely on sensitive personal data. Protecting the privacy and confidentiality of individuals whose data is used is paramount.
- Anonymization and De-identification: While techniques exist to remove direct identifiers from datasets, re-identification can sometimes still be possible by linking anonymized data with other available information. Robust anonymization methods are crucial.
- Data Security: Secure storage and access control for datasets containing sensitive information are essential to prevent unauthorized access or breaches.
- Informed Consent: When collecting data directly from individuals, obtaining informed consent regarding how their data will be used, including for model building, is an ethical requirement.
Failure to adequately protect data privacy can lead to significant harm to individuals and erode public trust in data-driven technologies.
Transparency in Model Deployment
Transparency in how linear regression models are built, deployed, and used is crucial for accountability and trust, especially when these models inform decisions that significantly impact people's lives (e.g., loan applications, medical diagnoses, parole decisions).
- Model Explainability: Linear regression is generally considered more interpretable than many complex "black-box" machine learning models. However, even with linear regression, clearly explaining which variables are driving predictions and the limitations of the model is important.
- Disclosure of Use: Individuals affected by decisions based on regression models should, where appropriate, be informed that such models were used and have a right to understand the basis of the decision.
- Auditability: The process of model development and deployment should be well-documented and auditable to ensure that ethical guidelines and regulatory requirements were followed.
A lack of transparency can make it difficult to identify and rectify errors or biases in models, and can undermine public confidence.
Regulatory Compliance (e.g., GDPR, Industry Standards)
Various regulations and industry standards govern the collection, use, and storage of data, as well as the deployment of analytical models. Practitioners using linear regression must be aware of and comply with these requirements.
- Data Protection Regulations: Laws like the General Data Protection Regulation (GDPR) in Europe impose strict rules on handling personal data, including requirements for consent, data minimization, and individuals' rights to access and control their data. Similar regulations exist in other jurisdictions.
- Industry-Specific Regulations: Sectors like finance and healthcare often have specific regulations regarding data privacy, model validation, and non-discrimination (e.g., fair lending laws in finance, HIPAA in US healthcare).
- Professional Ethical Codes: Many professional organizations for statisticians, data scientists, and researchers have codes of conduct that provide guidance on ethical practice. The American Statistical Association's "Ethical Guidelines for Statistical Practice" is one such example, emphasizing principles of professionalism, integrity of data and methods, and responsibilities to various stakeholders.
Ensuring compliance is not just a legal obligation but also an ethical responsibility to protect individuals and maintain the integrity of the analytical work.
Current Trends and Future Directions
Linear regression, despite being a foundational technique, continues to evolve and find new relevance in the rapidly changing landscape of data science and artificial intelligence. Its integration with more complex methodologies and its role in the face of new technological advancements are key aspects of its current and future trajectory.
Integration with Machine Learning Pipelines
In modern data science, linear regression is rarely used in complete isolation. Instead, it's often a component within larger machine learning pipelines. It can serve as:
- A Baseline Model: Before deploying more complex algorithms, data scientists often start with a simple linear regression model to establish a performance baseline. This helps in evaluating whether more sophisticated models offer a significant improvement.
- A Feature Engineering Tool: The coefficients from a linear regression can sometimes provide insights into the importance or relationship of certain features, which can inform feature selection or engineering for other models.
- A Component in Ensemble Methods: While less common for linear regression itself, the principles of combining simpler models to create a more powerful one (ensembling) are prevalent in machine learning.
- An Interpretable Alternative: In situations where model interpretability is paramount (e.g., in regulated industries or when explaining decisions to non-technical stakeholders), linear regression might be preferred over more complex "black box" models, even if there's a slight trade-off in predictive accuracy.
The ability to seamlessly integrate linear regression into automated workflows using tools like Python's scikit-learn or R's extensive statistical packages makes it a practical choice in many analytical pipelines.
These courses explore the broader context of machine learning where linear regression plays a part:
Automated Regression Tools (AutoML)
The rise of Automated Machine Learning (AutoML) tools is changing how regression tasks, including linear regression, are approached. AutoML platforms aim to automate some of the more time-consuming aspects of model building, such as:
- Data Preprocessing: Automatically handling missing values, encoding categorical variables, and scaling features.
- Feature Selection/Engineering: Identifying the most relevant features or creating new ones.
- Model Selection: Trying out various algorithms (including linear regression and its variants) and selecting the best-performing one for a given dataset and task.
- Hyperparameter Optimization: Tuning the settings of the chosen model to achieve optimal performance.
While AutoML can significantly speed up the modeling process and make machine learning more accessible, it doesn't eliminate the need for human oversight and statistical understanding. Practitioners still need to define the problem correctly, understand the data, interpret the results critically, and be aware of the ethical implications and limitations of the automated outputs. The World Economic Forum's Future of Jobs Report highlights the increasing importance of AI and big data skills, and AutoML is a part of this evolving landscape. Companies leveraging advanced analytics and AI are reported to gain significant competitive advantages.
High-Dimensional Data Challenges
Modern datasets are often "high-dimensional," meaning they have a very large number of features (independent variables) compared to the number of observations. This presents challenges for traditional linear regression:
- Overfitting: With many features, there's a higher risk of the model fitting the noise in the training data rather than the true underlying relationship, leading to poor performance on new, unseen data.
- Multicollinearity: When many features are present, it's more likely that some of them will be highly correlated, making it difficult to disentangle their individual effects and leading to unstable coefficient estimates.
- Interpretability: A model with hundreds or thousands of coefficients is much harder to interpret than a model with just a few.
To address these challenges, variations of linear regression have been developed, such as:
- Regularization Techniques (e.g., Ridge Regression, Lasso Regression): These methods add a penalty term to the OLS objective function to shrink some coefficients towards zero, which can help prevent overfitting and perform implicit feature selection.
- Principal Component Regression (PCR) and Partial Least Squares (PLS) Regression: These techniques first reduce the dimensionality of the feature space before fitting a regression model.
Dealing with high-dimensional data effectively is an ongoing area of research and development in statistics and machine learning.
This course touches upon aspects of statistical learning relevant to high-dimensional data:
Interpretability vs. Complexity Trade-offs
A persistent theme in the application of statistical and machine learning models is the trade-off between model interpretability and model complexity (which often correlates with predictive power).
- Linear Regression is generally considered highly interpretable. The coefficients directly indicate the strength and direction of the relationship between each independent variable and the dependent variable (assuming other variables are held constant). This makes it easier to explain the model's workings and its predictions.
- More Complex Models (e.g., deep neural networks, complex ensemble methods) can often achieve higher predictive accuracy, especially on intricate datasets with non-linear relationships. However, their internal workings can be very difficult to understand, making them "black boxes."
The choice between a simpler, more interpretable model like linear regression and a more complex, less interpretable one depends on the specific application. In fields like finance or healthcare, where accountability and the ability to explain decisions are critical, interpretability may be prioritized. In applications like image recognition or natural language processing, where raw predictive power is often the primary goal, more complex models might be favored. There's a growing field of research focused on "Explainable AI" (XAI) which aims to develop techniques to make even complex models more understandable, bridging this gap.
Challenges and Limitations
While linear regression is a versatile and widely used statistical tool, it's important to be aware of its inherent challenges and limitations. Understanding these can help practitioners apply the technique more effectively and avoid common pitfalls.
Overfitting and Underfitting Mitigation
Two common problems when building predictive models, including linear regression, are overfitting and underfitting.
Overfitting occurs when a model learns the training data too well, capturing not only the underlying relationships but also the noise or random fluctuations in the data. Such a model will perform very well on the training data but poorly on new, unseen data because it has not generalized well. In linear regression, overfitting can happen if the model is too complex for the amount of data available (e.g., including too many independent variables, especially if they are not truly predictive, or fitting high-order polynomial terms).
Underfitting occurs when a model is too simple to capture the underlying structure of the data. Such a model will perform poorly on both the training data and new data. In linear regression, underfitting can happen if a linear model is used when the true relationship is non-linear, or if important predictor variables are omitted from the model.
Mitigation strategies include:
- Cross-validation: A technique to assess how the model will generalize to an independent dataset. It involves splitting the data into training and testing sets multiple times.
- Regularization (for overfitting): Techniques like Ridge and Lasso regression add a penalty for complexity, which can help prevent overfitting by shrinking coefficients.
- Feature selection (for overfitting): Carefully selecting only the most relevant predictors.
- Increasing model complexity (for underfitting): Considering non-linear terms (e.g., polynomial regression) or adding more relevant predictor variables.
- Gathering more data: Often helps in building more robust models that are less prone to both overfitting and underfitting.
This course discusses model fitting, which is relevant to understanding overfitting and underfitting:
Multicollinearity Detection and Handling
Multicollinearity is a phenomenon in multiple linear regression where two or more independent variables are highly correlated with each other. This doesn't necessarily reduce the overall predictive power of the model, but it can cause significant problems with the interpretation of the individual regression coefficients:
- Unstable Coefficients: The estimated coefficients can change dramatically in response to small changes in the data or the model specification.
- Inflated Standard Errors: This makes the coefficients appear less statistically significant than they might actually be, and confidence intervals for the coefficients will be wider.
- Difficulty in Isolating Individual Effects: It becomes hard to determine the independent effect of each correlated predictor on the dependent variable because their effects are confounded.
Detection methods for multicollinearity include:
- Correlation Matrix: Examining the correlation coefficients between pairs of independent variables. High correlations (e.g., > 0.7 or 0.8) are a warning sign.
- Variance Inflation Factor (VIF): VIF measures how much the variance of an estimated regression coefficient is increased because of multicollinearity. A common rule of thumb is that a VIF greater than 5 or 10 indicates problematic multicollinearity.
Handling multicollinearity might involve:
- Removing one or more of the highly correlated variables.
- Combining the correlated variables into a single composite variable (e.g., an index).
- Using specialized regression techniques like Ridge regression, which is less affected by multicollinearity.
- Collecting more data, if feasible, as sometimes multicollinearity is a feature of the specific dataset rather than an inherent problem.
This course covers diagnostics, which would include multicollinearity detection:
Handling Non-Linear Relationships
Standard linear regression assumes a linear relationship between the independent and dependent variables. If the true relationship is non-linear, a simple linear regression model will provide a poor fit and inaccurate predictions. For example, the relationship between fertilizer and crop yield might be positive up to a certain point, after which additional fertilizer has diminishing returns or even negative effects – a clearly non-linear pattern.
Ways to handle non-linear relationships within the general framework of regression include:
- Polynomial Regression: This involves adding polynomial terms (e.g., X², X³) of the independent variables to the model. For example, Y = β₀ + β₁X + β₂X² + ε. This allows the model to fit a curve to the data.
- Transformations: Applying mathematical transformations (e.g., logarithmic, square root, reciprocal) to the independent variable(s) and/or the dependent variable can sometimes linearize the relationship. For instance, if Y grows exponentially with X, taking the logarithm of Y might create a linear relationship with X.
- Generalized Additive Models (GAMs): These are more flexible models that can fit non-linear relationships using smooth functions (splines) for each predictor, while still maintaining a degree of additivity and interpretability.
- Non-parametric Regression Techniques: Methods like kernel regression or splines that do not assume a specific functional form for the relationship.
Recognizing when a linear model is inappropriate and knowing how to address non-linearity are crucial skills for effective data analysis.
This course covers adapting linear regression for non-linear relationships:
Causal Inference Limitations
One of the most significant limitations of linear regression (and many other statistical modeling techniques) is that correlation does not imply causation. A regression model can show a strong statistical relationship between variables, but it cannot, on its own, prove that changes in one variable cause changes in another. There might be:
- Confounding Variables: An unobserved third variable might be influencing both the independent and dependent variables, creating a spurious correlation between them. For example, ice cream sales and crime rates might be positively correlated, not because ice cream causes crime, but because both tend to increase during hot weather (a confounding variable).
- Reverse Causality: It's possible that the dependent variable is actually causing changes in the independent variable, or that the relationship is bidirectional.
Establishing causality typically requires more than just observational data and regression analysis. It often involves:
- Randomized Controlled Trials (RCTs): The gold standard for causal inference, where subjects are randomly assigned to treatment and control groups.
- Quasi-Experimental Designs: Methods like difference-in-differences, regression discontinuity, and instrumental variables, which attempt to mimic experimental conditions using observational data and clever research design.
- Strong Theoretical Justification: A plausible mechanism explaining how X might cause Y.
While linear regression can be a tool within these more advanced causal inference frameworks (e.g., to control for covariates), it's crucial not to overstate its causal implications when used with purely observational data.
Frequently Asked Questions (Career Focus)
Navigating a career that involves linear regression can bring up many practical questions. Here are answers to some common queries, particularly for those focused on job prospects and career development.
What industries value linear regression skills most?
Skills in linear regression are highly valued across a multitude of industries. Some of the most prominent include:
- Finance and Insurance: For risk assessment, fraud detection, algorithmic trading, credit scoring, and actuarial science.
- Technology: In areas like A/B testing, user behavior analysis, optimizing search algorithms, and developing recommendation systems. Many tech companies heavily invest in data science where regression is a fundamental tool.
- Marketing and Advertising: To measure campaign effectiveness, forecast sales, understand customer lifetime value, and optimize marketing spend.
- Healthcare and Pharmaceuticals: For clinical trial analysis, epidemiological studies, predicting patient outcomes, and drug discovery.
- Consulting: Management and data consultants frequently use regression to help clients solve business problems across various sectors.
- Retail and E-commerce: For demand forecasting, inventory management, pricing optimization, and customer segmentation.
- Government and Public Sector: For policy analysis, economic forecasting, resource allocation, and social science research.
- Manufacturing: For quality control, predictive maintenance, and process optimization.
Can I work with linear regression without a mathematics or statistics degree?
Yes, it is possible to work with linear regression without a formal degree specifically in mathematics or statistics, especially in more applied roles. Many successful data analysts and even data scientists come from diverse educational backgrounds (e.g., economics, social sciences, business, computer science, engineering) and have acquired the necessary skills through a combination of coursework in their major, online courses, bootcamps, and self-study.
What's crucial is a solid understanding of the underlying concepts, the assumptions of the model, how to implement it using software (like Python or R), and how to interpret the results correctly and critically. While a deep theoretical math/stats background is essential for developing new statistical methods or working in highly research-oriented roles, many industry positions prioritize practical application and problem-solving skills. Demonstrating proficiency through a strong portfolio of projects can often be as, or even more, compelling to employers than a specific degree title. However, a foundational understanding of algebra and basic statistical principles will be necessary to grasp and apply linear regression effectively.
Online platforms like OpenCourser list numerous courses that can help build these skills, regardless of your initial degree. For example, you can browse Computer Science courses or Business courses that incorporate data analysis components.
How does linear regression relate to machine learning roles?
Linear regression is a fundamental algorithm in the field of supervised machine learning. For many machine learning practitioners, it's one of the first predictive modeling techniques they learn. In machine learning roles, linear regression is used for:
- Predicting continuous values: This is its primary application, such as forecasting sales, predicting prices, or estimating quantities.
- Serving as a baseline model: Its performance is often used as a benchmark to evaluate more complex machine learning algorithms. If a sophisticated model doesn't significantly outperform a simple linear regression, the added complexity might not be justified.
- Feature engineering and selection: Understanding the relationships identified by linear regression can help in selecting relevant features or creating new ones for other machine learning models.
- Interpretability: When it's important to understand *why* a model makes certain predictions, linear regression offers more transparency than many "black-box" models.
These courses provide context on how linear regression fits into the broader machine learning landscape:
What tools and programming languages are essential?
To practically apply linear regression, proficiency in certain tools and programming languages is essential:
-
Python: Currently one of the most popular languages for data science and machine learning. Key Python libraries for linear regression include:
- Scikit-learn: A comprehensive machine learning library that provides easy-to-use implementations of linear regression and many other algorithms, along with tools for model evaluation and selection.
- StatsModels: A library that focuses more on traditional statistical modeling, providing detailed statistical output, including p-values, confidence intervals, and diagnostic tests for regression models.
- NumPy and Pandas: Essential for numerical computation and data manipulation/analysis, respectively. These are used to prepare data for regression.
- R: A programming language and environment specifically designed for statistical computing and graphics. R has extensive packages for all types of regression analysis and is widely used by statisticians and researchers.
- SQL: While not directly for performing regression, SQL (Structured Query Language) is crucial for extracting and managing data from relational databases, which is often the first step in any data analysis project.
- Excel: For simpler linear regression analyses and quick explorations, Microsoft Excel's data analysis ToolPak can perform regression. It's also useful for data visualization and presentation.
- Specialized Statistical Software: Packages like SAS, SPSS, and Stata are also widely used, particularly in academic research, healthcare, and some corporate environments. SAS, for instance, has robust capabilities for regression and ANOVA.
Familiarity with data visualization tools (e.g., Matplotlib and Seaborn in Python, ggplot2 in R, Tableau, Power BI) is also important for understanding data and communicating regression results.
These courses focus on implementing regression in popular languages:
This book is helpful for those using SAS:
Is linear regression becoming obsolete with AI advances?
No, linear regression is not becoming obsolete with advances in AI. While more complex AI models like deep learning have shown remarkable performance on certain types of tasks (e.g., image recognition, natural language processing), linear regression retains its importance for several reasons:
- Interpretability: It's much easier to understand and explain the relationship between variables using a linear regression model than a complex neural network. This is crucial in many business and scientific contexts.
- Simplicity and Efficiency: Linear regression is computationally less intensive and faster to train than many advanced AI models, making it a good choice for problems where a simpler solution suffices or for quick initial analyses.
- Baseline Performance: It serves as an important benchmark. If a complex AI model cannot significantly outperform a simple linear regression, the added complexity and computational cost of the AI model may not be justified.
- Foundation for Other Techniques: Many advanced statistical and machine learning techniques are extensions or variations of linear regression, or share similar underlying principles. A strong understanding of linear regression provides a solid foundation for learning these more complex methods.
- Small Data Scenarios: Complex AI models often require vast amounts of data to train effectively. In situations with limited data, simpler models like linear regression can be more robust and less prone to overfitting.
What salary ranges exist for regression-focused roles?
Salaries for roles that utilize linear regression skills can vary widely based on factors such as:
- Job Title and Seniority: Entry-level Data Analyst roles will typically have lower salaries than senior Data Scientist or Machine Learning Engineer positions. Management roles (e.g., Analytics Manager) will also command higher salaries.
- Industry: Industries like tech, finance, and consulting often offer higher compensation for data-related roles compared to some other sectors.
- Geographic Location: Salaries can differ significantly between cities and regions due to variations in cost of living and demand for skills. For instance, data science salaries in major tech hubs may be higher.
- Education and Experience: Advanced degrees (Master's, Ph.D.) and years of relevant experience generally lead to higher earning potential.
- Specific Skill Set: Proficiency in high-demand programming languages (like Python), experience with cloud platforms, and expertise in specialized areas of machine learning can also influence salary.
Conclusion
Linear regression stands as a remarkably enduring and versatile tool in the world of data analysis. From its historical roots to its current applications in cutting-edge fields, it provides a powerful yet understandable method for uncovering relationships, making predictions, and informing decisions. Whether you are just beginning your journey into data, seeking to pivot your career, or aiming to deepen your analytical expertise, a solid understanding of linear regression offers a strong foundation and a pathway to numerous exciting opportunities. While the world of data science continues to evolve with increasing complexity, the fundamental principles embodied by linear regression remain as relevant as ever. Embracing the challenges of learning this technique, understanding its nuances, and applying it ethically will undoubtedly equip you with valuable skills for a data-driven future.
To further your exploration, consider browsing the wide array of courses and topics available on OpenCourser, or delve into our OpenCourser Notes blog for more insights into the world of online learning and data science.


