We may earn an affiliate commission when you visit our partners.
Course image
Course image
Coursera logo

Using Shiny to Plot Differential Gene Expression

Usama A. F. Khalil

In this project-based course, you will create a Shiny app to plot gene expression data (Real-Time PCR) from a published manuscript. You will build the Shiny app from scratch and handle every component of Shiny. The project covers data processing and collecting feedback from the user to build and finetune the output.

Read more

In this project-based course, you will create a Shiny app to plot gene expression data (Real-Time PCR) from a published manuscript. You will build the Shiny app from scratch and handle every component of Shiny. The project covers data processing and collecting feedback from the user to build and finetune the output.

In this course, we will be concerned with the optimal use of inputs and outputs. Instead of building a lot of inputs and outputs, we will use a limited number of components and recycle some even seven times for different purposes.

Enroll now

What's inside

Syllabus

Using Shiny to Plot Differential Gene Expression
Welcome to Using Shiny to Plot Differential Gene Expression Project! You’re joining thousands of learners currently enrolled in the Rhyme guided project program. I'm excited to have you in the class and look forward to your contributions to the learning community. To begin, I recommend taking a few minutes to explore the course site. Review the material we’ll cover during the project, and preview the assignments you’ll need to complete to pass the course. Click Discussions to see forums where you can discuss the course material with fellow students taking the class. By the end of this project, you will create a Shiny app to plot gene expression data (Real-Time PCR) from a published manuscript. You will build the Shiny app from scratch, along the way together we will handle every component of Shiny. If you have questions about course content, please post them in the forums to get help from others in the course community. For technical problems with the Coursera platform, visit the Learner Help Center. Good luck as you get started and I hope you enjoy the course!

Good to know

Know what's good
, what to watch for
, and possible dealbreakers
Suitable for those with experience in manipulating gene expression data using real-time PCR
Designed for beginners who want to build a Shiny app from scratch
Helpful for learners interested in data processing and user feedback
Teaches essential components of Shiny for handling inputs and outputs
Applicable to industry practices
Taught by an expert in the field

Save this course

Save Using Shiny to Plot Differential Gene Expression to your list so you can find it easily later:
Save

Reviews summary

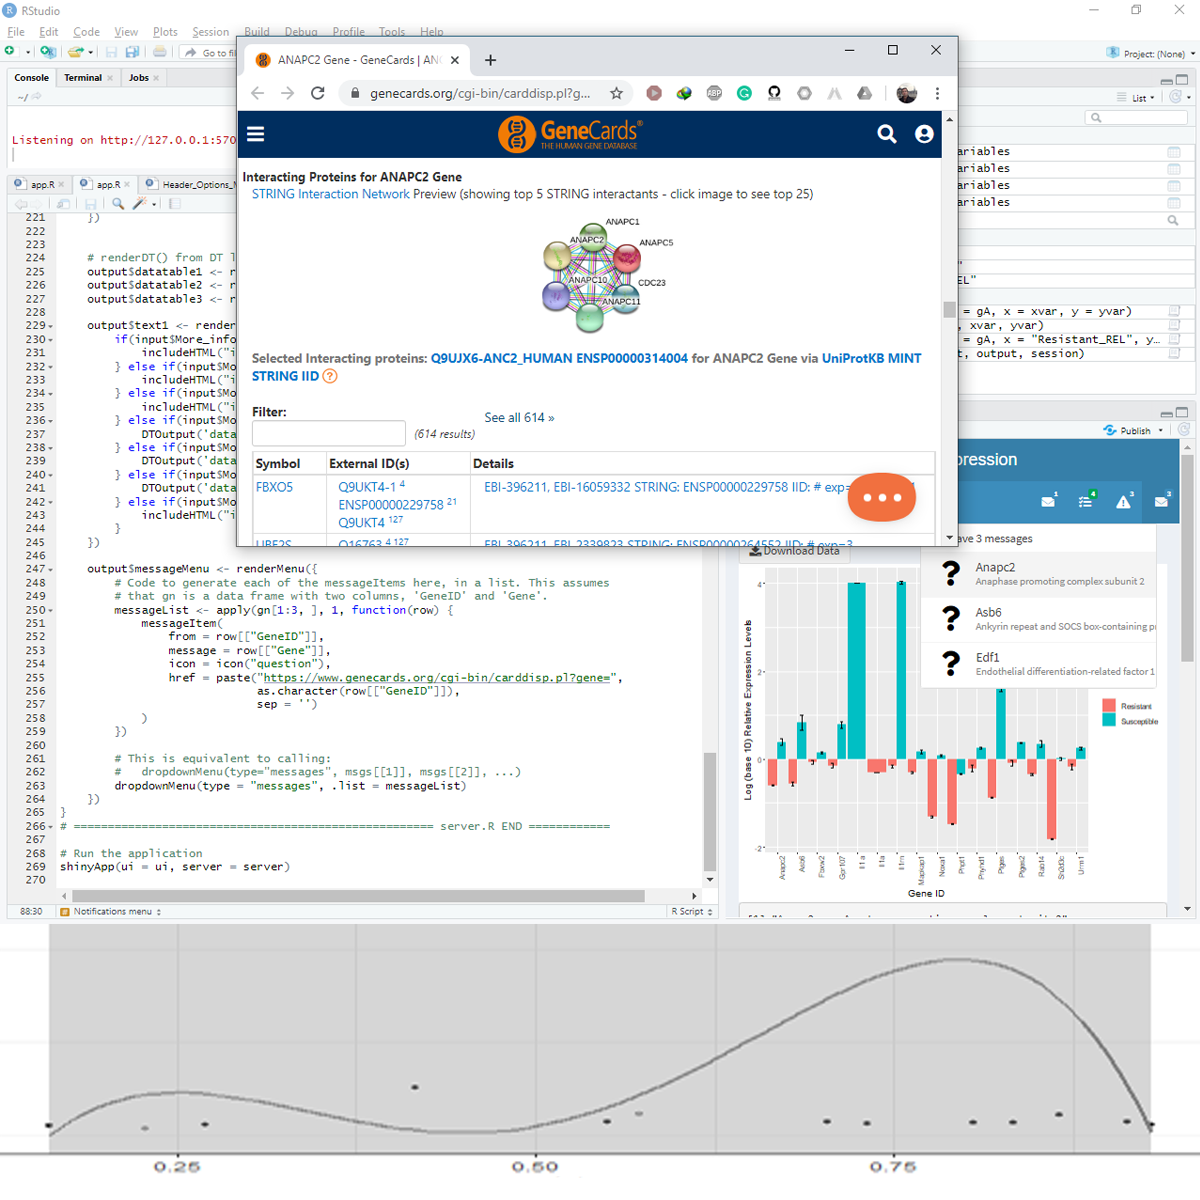
Useful shiny app creation tutorial

According learners, this well received course provides a valuable tutorial on creating Shiny apps in RStudio. While some students found the speaker's accent difficult to follow, many praised the engaging lessons. The course consists of well-structured materials and helpful resources.
Informative materials
"Great project!."
"I have learnt a lot from this."
"The informations are quite effective and interesting"
Instructor's accent hard to follow
"speaker's strong accent made following him a little tricky for 100% of the videos."

Activities

Coming soon We're preparing activities for Using Shiny to Plot Differential Gene Expression. These are activities you can do either before, during, or after a course.

Career center

Learners who complete Using Shiny to Plot Differential Gene Expression will develop knowledge and skills that may be useful to these careers:
Data Analyst
Data Analysts sift through large datasets to find trends and insights. Using their expertise in statistics and programming, they can uncover hidden patterns and correlations. This course on Using Shiny to Plot Differential Gene Expression will provide Data Analysts with the skills needed to create interactive data visualizations that can help communicate complex findings to stakeholders. By learning how to build Shiny apps from scratch, Data Analysts can create custom dashboards and reports that allow users to explore data in a variety of ways.
Biostatistician
Biostatisticians apply statistical methods to solve problems in the life sciences. They design and conduct studies, analyze data, and interpret results. This course on Using Shiny to Plot Differential Gene Expression will provide Biostatisticians with the skills needed to create interactive data visualizations that can help communicate complex findings to researchers and policymakers. By learning how to build Shiny apps from scratch, Biostatisticians can create custom dashboards and reports that allow users to explore data in a variety of ways.
Research Scientist
Research Scientists conduct experiments and collect data to test hypotheses and develop new theories. They use their knowledge of scientific methods and statistical analysis to design and conduct studies, analyze data, and interpret results. This course on Using Shiny to Plot Differential Gene Expression will provide Research Scientists with the skills needed to create interactive data visualizations that can help communicate complex findings to colleagues and the public. By learning how to build Shiny apps from scratch, Research Scientists can create custom dashboards and reports that allow users to explore data in a variety of ways.
Data Visualization Engineer
Data Visualization Engineers design and develop data visualizations that communicate complex information in a clear and concise way. They use their knowledge of data visualization principles and programming to create interactive dashboards and reports that allow users to explore data in a variety of ways. This course on Using Shiny to Plot Differential Gene Expression will provide Data Visualization Engineers with the skills needed to create interactive data visualizations of gene expression data. By learning how to build Shiny apps from scratch, Data Visualization Engineers can create custom dashboards and reports that allow users to explore data in a variety of ways.
Web Developer
Web Developers design and develop websites and web applications. They use their knowledge of HTML, CSS, and JavaScript to create websites that are both visually appealing and functional. This course on Using Shiny to Plot Differential Gene Expression will provide Web Developers with the skills needed to create interactive data visualizations of gene expression data. By learning how to build Shiny apps from scratch, Web Developers can create custom dashboards and reports that allow users to explore data in a variety of ways.
Software Engineer
Software Engineers design, develop, and maintain software applications. They use their knowledge of programming languages and software development principles to create software that solves problems and meets the needs of users. This course on Using Shiny to Plot Differential Gene Expression will provide Software Engineers with the skills needed to create interactive data visualizations of gene expression data. By learning how to build Shiny apps from scratch, Software Engineers can create custom dashboards and reports that allow users to explore data in a variety of ways.
Data Journalist
Data Journalists use data to tell stories and inform the public. They use their knowledge of data analysis and visualization to create articles, infographics, and other data-driven content. This course on Using Shiny to Plot Differential Gene Expression will provide Data Journalists with the skills needed to create interactive data visualizations of gene expression data. By learning how to build Shiny apps from scratch, Data Journalists can create custom dashboards and reports that allow users to explore data in a variety of ways.
Bioinformatician
Bioinformaticians use computational tools to analyze biological data. They use their knowledge of biology, computer science, and statistics to develop new methods for analyzing and interpreting data. This course on Using Shiny to Plot Differential Gene Expression will provide Bioinformaticians with the skills needed to create interactive data visualizations of gene expression data. By learning how to build Shiny apps from scratch, Bioinformaticians can create custom dashboards and reports that allow users to explore data in a variety of ways.
Quantitative Analyst
Quantitative Analysts use mathematical and statistical models to analyze financial data. They use their knowledge of finance and mathematics to develop trading strategies and make investment decisions. This course on Using Shiny to Plot Differential Gene Expression may be useful for Quantitative Analysts who want to learn how to create interactive data visualizations of financial data. By learning how to build Shiny apps from scratch, Quantitative Analysts can create custom dashboards and reports that allow users to explore data in a variety of ways.
Operations Research Analyst
Operations Research Analysts use mathematical and statistical models to solve problems in business and industry. They use their knowledge of optimization, simulation, and other techniques to improve efficiency and decision-making. This course on Using Shiny to Plot Differential Gene Expression may be useful for Operations Research Analysts who want to learn how to create interactive data visualizations of operations data. By learning how to build Shiny apps from scratch, Operations Research Analysts can create custom dashboards and reports that allow users to explore data in a variety of ways.
Market Research Analyst
Market Research Analysts collect and analyze data about markets and consumers. They use their knowledge of research methods and statistics to identify trends and develop marketing strategies. This course on Using Shiny to Plot Differential Gene Expression may be useful for Market Research Analysts who want to learn how to create interactive data visualizations of market data. By learning how to build Shiny apps from scratch, Market Research Analysts can create custom dashboards and reports that allow users to explore data in a variety of ways.
Business Analyst
Business Analysts use data and analysis to solve business problems and improve decision-making. They use their knowledge of business processes, data analysis, and technology to develop solutions that meet the needs of stakeholders. This course on Using Shiny to Plot Differential Gene Expression may be useful for Business Analysts who want to learn how to create interactive data visualizations of business data. By learning how to build Shiny apps from scratch, Business Analysts can create custom dashboards and reports that allow users to explore data in a variety of ways.
Statistician
Statisticians use data and analysis to solve problems in a variety of fields, including business, healthcare, and science. They use their knowledge of statistics, probability, and programming to develop solutions that meet the needs of stakeholders. This course on Using Shiny to Plot Differential Gene Expression may be useful for Statisticians who want to learn how to create interactive data visualizations of data. By learning how to build Shiny apps from scratch, Statisticians can create custom dashboards and reports that allow users to explore data in a variety of ways.
Machine Learning Engineer
Machine Learning Engineers use machine learning algorithms to solve problems in a variety of fields, including business, healthcare, and science. They use their knowledge of machine learning, programming, and statistics to develop solutions that meet the needs of stakeholders. This course on Using Shiny to Plot Differential Gene Expression may be useful for Machine Learning Engineers who want to learn how to create interactive data visualizations of data. By learning how to build Shiny apps from scratch, Machine Learning Engineers can create custom dashboards and reports that allow users to explore data in a variety of ways.
Data Scientist
Data Scientists use data and analysis to solve problems in a variety of fields, including business, healthcare, and science. They use their knowledge of statistics, machine learning, and programming to develop solutions that meet the needs of stakeholders. This course on Using Shiny to Plot Differential Gene Expression may be useful for Data Scientists who want to learn how to create interactive data visualizations of data. By learning how to build Shiny apps from scratch, Data Scientists can create custom dashboards and reports that allow users to explore data in a variety of ways.

Reading list

We've selected 12 books that we think will supplement your learning. Use these to develop background knowledge, enrich your coursework, and gain a deeper understanding of the topics covered in Using Shiny to Plot Differential Gene Expression.
Provides a comprehensive introduction to the R programming language, with a focus on data science applications. It covers a wide range of topics, from data manipulation and visualization to statistical modeling and machine learning.
Provides a comprehensive overview of the ggplot2 package in R, which is used for creating visualizations. It covers the basics of ggplot2, as well as more advanced topics such as creating complex plots and customizing the appearance of plots.
Provides a practical introduction to data visualization. It covers a wide range of topics, from the basics of data visualization to more advanced topics such as creating interactive visualizations and dashboards.
Provides a comprehensive overview of the R programming language. It covers a wide range of topics, from the basics of R to more advanced topics such as object-oriented programming and statistical modeling.
Provides a comprehensive introduction to statistical learning. It covers a wide range of topics, from the basics of statistical learning to more advanced topics such as machine learning and deep learning.
Provides a comprehensive overview of deep learning using R. It covers a wide range of topics, from the basics of deep learning to more advanced topics such as convolutional neural networks and recurrent neural networks.
Provides a comprehensive introduction to bioinformatics. It covers a wide range of topics, from the basics of bioinformatics to more advanced topics such as sequence analysis and gene expression analysis.
Provides a comprehensive overview of the molecular biology of the cell. It covers a wide range of topics, from the basics of cell biology to more advanced topics such as cell signaling and gene expression.
Provides a comprehensive introduction to biostatistics. It covers a wide range of topics, from the basics of biostatistics to more advanced topics such as statistical methods and data analysis.
Provides a comprehensive overview of the Python programming language for data analysis. It covers a wide range of topics, from the basics of Python to more advanced topics such as data manipulation and visualization.
Provides a comprehensive introduction to machine learning. It covers a wide range of topics, from the basics of machine learning to more advanced topics such as supervised learning and unsupervised learning.

Share

Help others find this course page by sharing it with your friends and followers:

Similar courses

Here are nine courses similar to Using Shiny to Plot Differential Gene Expression.
Programming for Everyone : Working with Data
Most relevant
Data Analysis with Shiny: R Playbook
Most relevant
Building Your First R Shiny 1 Application
Most relevant
Teaching Physical Computing with Raspberry Pi and Python
Most relevant
Dashboard Development with Shiny: GenAI for Retail...
Most relevant
Programming for Everyone : Building a Fun Web App
Most relevant
Visualizing Data with R
Fundamentals of Electrical Instrumentation
Node with React: Fullstack Web Development
Our mission

OpenCourser helps millions of learners each year. People visit us to learn workspace skills, ace their exams, and nurture their curiosity.

Our extensive catalog contains over 50,000 courses and twice as many books. Browse by search, by topic, or even by career interests. We'll match you to the right resources quickly.

Find this site helpful? Tell a friend about us.

Affiliate disclosure

We're supported by our community of learners. When you purchase or subscribe to courses and programs or purchase books, we may earn a commission from our partners.

Your purchases help us maintain our catalog and keep our servers humming without ads.

Thank you for supporting OpenCourser.

© 2016 - 2024 OpenCourser