April 11, 2024
Updated May 23, 2025
17 minute read
Navigating the World of Information Design: A Comprehensive Career Guide
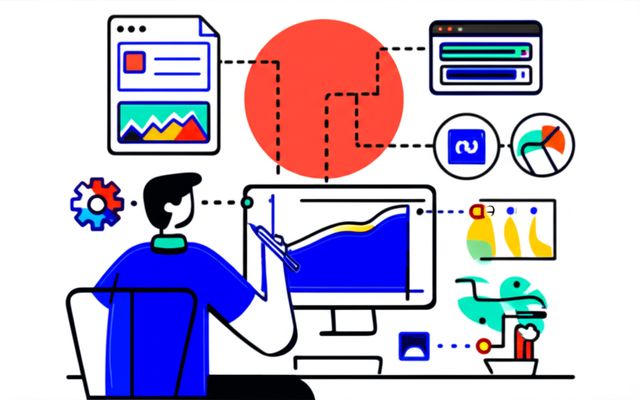
Information Design is a dynamic and increasingly vital field dedicated to making complex information clear, accessible, and engaging. It's the art and science of presenting data and concepts in a way that helps people understand and interact with them effectively. In a world saturated with data, information designers act as crucial interpreters, transforming raw facts and figures into meaningful narratives and visual experiences.
Working as an information designer can be incredibly rewarding. You might find yourself creating compelling infographics that simplify intricate processes, designing intuitive dashboards that empower data-driven decisions, or developing clear visual systems that guide people through complex environments. The field offers a unique blend of creativity, analytical thinking, and a focus on user-centered communication, making it an exciting path for those passionate about clarity and understanding in a complex world.
qzqrl3|
Find a path to becoming a Information Designer. Learn more at:
OpenCourser.com/career/qzqrl3/information
Reading list
We haven't picked any books for this reading list yet.
Provides a comprehensive overview of visual support, including its history, theory, and practice. It is an excellent resource for anyone who wants to learn more about how to use visual aids effectively.
Is the seminal work on the Grammar of Graphics and provides a comprehensive overview of the topic. It is highly recommended for anyone who wants to learn more about the Grammar of Graphics.
This foundational text must-read for anyone serious about information design. It presents fundamental principles for creating effective graphs, charts, and tables, emphasizing clarity and integrity in data presentation. While a classic, its principles remain highly relevant for understanding the core concepts of visualizing quantitative data.
This popular book focuses on the narrative aspect of information design, teaching readers how to create compelling data visualizations that tell a story. It's highly accessible and practical, making it an excellent starting point for students and professionals new to the field or looking to improve their communication skills. is commonly used as a textbook or reference in industry.
Classic in the field of information architecture and provides a comprehensive overview of the principles and practices of designing effective websites and applications.
Provides a practical introduction to data visualization, including a chapter on the Grammar of Graphics. It good option for those who want to learn more about the Grammar of Graphics in the context of data visualization.
Provides a comprehensive guide to using the ggplot2 package in R to create visualizations. ggplot2 popular implementation of the Grammar of Graphics, so this book good option for those who want to learn more about the Grammar of Graphics in the context of R.
Focuses on the design of information dashboards and provides guidance on how to create dashboards that are effective at communicating data insights. It valuable resource for anyone who is involved in the design or development of dashboards.
Provides a practical guide to using visual supports with children with autism. It includes step-by-step instructions on how to create and use visual supports, as well as case studies of how visual supports have been used successfully with children with autism.
Comprehensive guide to information design for the web. Halvorson covers a wide range of topics, including the principles of visual design, the use of typography and color, and the design of different types of web pages.
Provides a comprehensive overview of the field of information graphics and covers a wide range of topics, including the principles of visual perception, the use of color and typography, and the design of different types of information graphics. It valuable resource for anyone who wants to learn more about information graphics.
Provides a comprehensive history of visual communication. It is an excellent resource for anyone who wants to learn more about the origins and evolution of visual communication.
Published recently, this book offers a contemporary perspective on information design, focusing on key concepts and skills needed in a rapidly changing world. It provides a holistic view of the field, including ethical considerations and emerging practices, making it highly relevant for current students and professionals. It includes exercises and case studies.
In this book, Alberto Cairo focuses on the potential for charts and visual information to mislead. It's a crucial read for anyone who consumes or creates visual information, fostering critical thinking and a deeper understanding of how to interpret data correctly. Highly relevant in the contemporary information landscape.
Alberto Cairo emphasizes the importance of accuracy and integrity in information design, particularly in journalism and communication. provides a strong foundation in data visualization principles and critical thinking, valuable for students and professionals who work with data in a communicative context. It helps solidify an understanding of ethical considerations.
Practical guide specifically focused on designing effective dashboards. It covers common design problems and best practices, drawing on principles of visual perception. It is highly relevant for professionals and students interested in business intelligence and data monitoring. This useful reference tool and often recommended for those building dashboards.
Provides a comprehensive introduction to the history, theory, and best practices of information visualization. It explores different types of visualizations and their applications, making it suitable for students and those seeking a solid academic foundation in the field. It covers a broad scope of the subject.
Serves as an introduction to the principles and practices of creating effective information graphics and visualizations. Cairo covers the history, theory, and practical application of information design, making it suitable for students and those seeking a broad understanding of the field. It provides a good overview of the subject matter.
Provides guidance on creating more effective data visualizations, moving beyond basic chart types. It's aimed at those in academia and research but is valuable for anyone who needs to present data clearly and persuasively. It offers strategies for improving visualizations.
Another practical guide by Stephen Few, this book provides concrete methods for designing tables and graphs that effectively communicate quantitative information. It's a valuable resource for anyone who needs to present data clearly and accurately, suitable for students and professionals alike. offers practical steps for creating informative visuals.
Emphasizes the importance of human factors and common sense in creating effective information design. It provides practical guidance for designers across various fields, focusing on making complex information clear and accessible. It's a useful resource for professionals and students.
Practical guide to designing effective data visualizations. Yau provides a step-by-step process for creating visualizations that are clear, concise, and engaging.
Comprehensive guide to using the R programming language for data visualization. Chang covers a wide range of topics, including the basics of data visualization, the use of different types of charts and graphs, and the creation of interactive visualizations.
Is another classic work on the use of visuals in communication. It focuses on how to use visuals to display quantitative information effectively.
For more information about how these books relate to this course, visit:
OpenCourser.com/career/qzqrl3/information