We may earn an affiliate commission when you visit our partners.
Course image
Tricia Bagley
“Tell me a story.” At some point, we all have either heard those words or uttered them ourselves. The strong desire to be transported and to understand through narrative is something that stays with us through adulthood and is activated in our personal and professional lives. Why are humans so profoundly impacted by stories? Studies show that narrative helps us to find meaning in information and activates a desire to connect with it. By engaging with a story, we open the door to allow the meaning of it to resonate with us. For decision-making, this translates to narrative, the story, acting as the vehicle to make data...
Read more
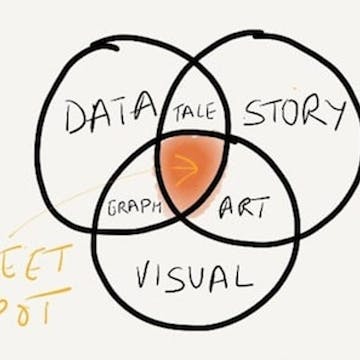
“Tell me a story.” At some point, we all have either heard those words or uttered them ourselves. The strong desire to be transported and to understand through narrative is something that stays with us through adulthood and is activated in our personal and professional lives. Why are humans so profoundly impacted by stories? Studies show that narrative helps us to find meaning in information and activates a desire to connect with it. By engaging with a story, we open the door to allow the meaning of it to resonate with us. For decision-making, this translates to narrative, the story, acting as the vehicle to make data actionable. In this project, you will gain hands-on experience telling a simple data story that will connect with a professional audience. The story will be told with graphics created from survey data collected by a hypothetical company that hopes to grow their understanding of the customer experience and uncover where business opportunities may lie. You will tell your survey data story using the free-to-use presentation software Google Slides. By the end of this project, you will be able to confidently tell a data story using any presentation software. Note: This course works best for learners who are based in the North America region. We’re currently working on providing the same experience in other regions.
Enroll now

Good to know

Know what's good
, what to watch for
, and possible dealbreakers
Builds a strong foundation for beginners
Taught by Tricia Bagley, who is recognized for her work in the topic that the course teaches
Teaches narrative, which is a core skill for decision-making
Develops narrative skills, which are core skills for navigating business opportunities
Teaches skills, knowledge, and/or tools that are highly relevant to industry
Teaches a simple data story using Google Slides

Save this course

Save Tell the Data Story with Survey Graphics in Google Slides to your list so you can find it easily later:
Save

Reviews summary

Helpful, still room for improvement

This course is great for learning how to use Google Slides and Sheets, but the data visualizations could be improved.
Good for learning Google Slides and Sheets.
"The course was most useful for navigating through Google Slides and Sheets"
Data visualizations could be better.
"However, the visualizations used were not the best to tell the 'data story'"

Activities

Be better prepared before your course. Deepen your understanding during and after it. Supplement your coursework and achieve mastery of the topics covered in Tell the Data Story with Survey Graphics in Google Slides with these activities:
Review Google Slides Basics
Ensure you have a solid foundation in Google Slides before creating your data story presentation.
Browse courses on Google Slides
Show steps
  • Create and format a new presentation.
  • Insert and edit text, images, and videos.
Compile Data Storytelling Resources
Gather and organize valuable resources to enhance your understanding of data storytelling.
Browse courses on Data Storytelling
Show steps
  • Search for articles, books, and online courses.
  • Bookmark and organize the resources in a central location.
Solve Data Analysis Problems
Sharpen your data analysis skills through targeted practice problems.
Browse courses on Data Analysis
Show steps
  • Identify the problem and data.
  • Apply appropriate analysis techniques.
  • Interpret the results and draw conclusions.
Five other activities
Expand to see all activities and additional details
Show all eight activities
Peer Review of Data Story Outlines
Get feedback on your data story outline from peers to refine and enhance its structure and effectiveness.
Browse courses on Peer Review
Show steps
  • Exchange outlines with a peer.
  • Provide constructive feedback on clarity, flow, and impact.
Create a Data Story Outline
Craft a compelling outline for your data story, ensuring a clear and engaging flow.
Browse courses on Data Storytelling
Show steps
  • Identify the key message and audience.
  • Gather and analyze relevant data.
  • Structure the story with an introduction, body, and conclusion.
Design a Data Visualization
Create a visually impactful data visualization to effectively communicate insights.
Browse courses on Data Visualization
Show steps
  • Select an appropriate visualization type.
  • Design the visualization with clarity and aesthetics.
  • Ensure proper data representation and labeling.
Contribute to a Data Storytelling Project
Engage in a hands-on project to apply your data storytelling skills while collaborating with others.
Browse courses on Data Storytelling
Show steps
  • Identify a suitable open-source project.
  • Review the project documentation and code.
  • Contribute to the project by adding features or fixing bugs.
Read The Storytelling Animal
Explore the impact of stories on human nature and improve your storytelling skills.
View The Story Paradox on Amazon
Show steps

Career center

Learners who complete Tell the Data Story with Survey Graphics in Google Slides will develop knowledge and skills that may be useful to these careers:
Data Analyst
A Data Analyst transforms raw data into meaningful insights that inform decision-making. This course provides a foundation in data analysis and visualization, which are essential skills for any Data Analyst. By learning how to tell a compelling data story, you can effectively communicate your findings to stakeholders and drive business decisions.
Data Scientist
Data Scientists use statistical and machine learning techniques to extract insights from data. This course provides an introduction to data visualization, which is an essential skill for any Data Scientist. By learning how to create clear and concise data visualizations, you can effectively communicate your findings to stakeholders and drive business decisions.
Market Researcher
Market Researchers conduct surveys and collect data to understand customer needs and preferences. This course provides a foundation in survey design and data analysis, which are essential skills for any Market Researcher. By learning how to design effective surveys and analyze data, you can gain valuable insights into customer behavior and drive business decisions.
Business Analyst
Business Analysts use data to identify and solve business problems. This course provides a foundation in data analysis and visualization, which are essential skills for any Business Analyst. By learning how to analyze data and create clear and concise data visualizations, you can effectively communicate your findings to stakeholders and drive business decisions.
Product Manager
Product Managers are responsible for the development and launch of new products. This course provides an introduction to data visualization, which is an essential skill for any Product Manager. By learning how to create clear and concise data visualizations, you can effectively communicate your product vision to stakeholders and drive product development.
UX Designer
UX Designers create user experiences for products and services. This course provides an introduction to data visualization, which is an essential skill for any UX Designer. By learning how to create clear and concise data visualizations, you can effectively communicate your design decisions to stakeholders and drive product development.
Marketing Manager
Marketing Managers are responsible for developing and executing marketing campaigns. This course provides an introduction to data visualization, which is an essential skill for any Marketing Manager. By learning how to create clear and concise data visualizations, you can effectively communicate your marketing campaign results to stakeholders and drive business decisions.
Sales Manager
Sales Managers are responsible for leading and managing sales teams. This course provides an introduction to data visualization, which is an essential skill for any Sales Manager. By learning how to create clear and concise data visualizations, you can effectively communicate your sales team's performance to stakeholders and drive sales growth.
Customer Success Manager
Customer Success Managers are responsible for ensuring that customers are satisfied with their products or services. This course provides an introduction to data visualization, which is an essential skill for any Customer Success Manager. By learning how to create clear and concise data visualizations, you can effectively communicate your customer satisfaction results to stakeholders and drive customer retention.
Project Manager
Project Managers are responsible for planning and executing projects. This course provides an introduction to data visualization, which is an essential skill for any Project Manager. By learning how to create clear and concise data visualizations, you can effectively communicate your project's progress to stakeholders and drive project success.
Operations Manager
Operations Managers are responsible for the day-to-day operations of a business. This course provides an introduction to data visualization, which is an essential skill for any Operations Manager. By learning how to create clear and concise data visualizations, you can effectively communicate your operational performance to stakeholders and drive business efficiency.
Financial Analyst
Financial Analysts are responsible for analyzing financial data and making investment recommendations. This course provides an introduction to data visualization, which is an essential skill for any Financial Analyst. By learning how to create clear and concise data visualizations, you can effectively communicate your investment recommendations to stakeholders and drive investment decisions.
Consultant
Consultants provide advice and guidance to businesses on a variety of topics. This course provides an introduction to data visualization, which is an essential skill for any Consultant. By learning how to create clear and concise data visualizations, you can effectively communicate your recommendations to stakeholders and drive business decisions.
Writer
Writers create content for a variety of purposes, including marketing, advertising, and journalism. This course provides an introduction to data visualization, which is an essential skill for any Writer. By learning how to create clear and concise data visualizations, you can effectively communicate your ideas to your audience and drive engagement.
Teacher
Teachers educate students in a variety of subjects. This course provides an introduction to data visualization, which is an essential skill for any Teacher. By learning how to create clear and concise data visualizations, you can effectively communicate your lesson plans to students and drive student learning.

Reading list

We've selected nine books that we think will supplement your learning. Use these to develop background knowledge, enrich your coursework, and gain a deeper understanding of the topics covered in Tell the Data Story with Survey Graphics in Google Slides.
This classic work on data visualization explores the principles of effective visual communication, emphasizing the importance of clarity, simplicity, and accuracy. It provides timeless insights and best practices for presenting data in a meaningful way.
This accessible book combines practical advice on data visualization with statistical principles. It provides insights into the effective use of charts, graphs, and maps for communicating complex information.
Focuses on the design and implementation of effective data dashboards. It provides guidance on creating clear, concise, and actionable visual displays that support informed decision-making.
This comprehensive guide covers the full range of Power BI capabilities, from data modeling to report creation and dashboarding. It provides detailed instructions and best practices for using Power BI to create powerful and interactive data visualizations.
This extensive resource showcases a wide range of real-world dashboard examples. It provides inspiration and practical guidance for creating effective visual displays that support business objectives.
While primarily focused on data analysis, this book also provides an introduction to data visualization using R, a powerful open-source statistical software. It covers basic and advanced techniques for creating charts, graphs, and interactive visualizations.
Introduces data visualization using Python, a popular programming language for data science. It provides hands-on examples and code snippets for creating various charts, graphs, and interactive plots using Python libraries such as Matplotlib and Seaborn.

Share

Help others find this course page by sharing it with your friends and followers:

Similar courses

Here are nine courses similar to Tell the Data Story with Survey Graphics in Google Slides.
Data Visualization in Google Slides
Most relevant
Intro Course: Data Storytelling
Most relevant
Uncover the Survey Data Story with Charts in Google Sheets
Most relevant
Writing a Personal Essay
Creating Data Stories with Qlik Sense
Strategic Communication for Sustainability Leaders
Data Visualization with Tableau Project
Essential Career Skills for Investment Banking and Finance
Creating an Interactive Graph with Tableau Public
Our mission

OpenCourser helps millions of learners each year. People visit us to learn workspace skills, ace their exams, and nurture their curiosity.

Our extensive catalog contains over 50,000 courses and twice as many books. Browse by search, by topic, or even by career interests. We'll match you to the right resources quickly.

Find this site helpful? Tell a friend about us.

Affiliate disclosure

We're supported by our community of learners. When you purchase or subscribe to courses and programs or purchase books, we may earn a commission from our partners.

Your purchases help us maintain our catalog and keep our servers humming without ads.

Thank you for supporting OpenCourser.

© 2016 - 2024 OpenCourser