May 1, 2024
Updated May 8, 2025
18 minute read
Unlocking Insights: A Comprehensive Guide to Charts
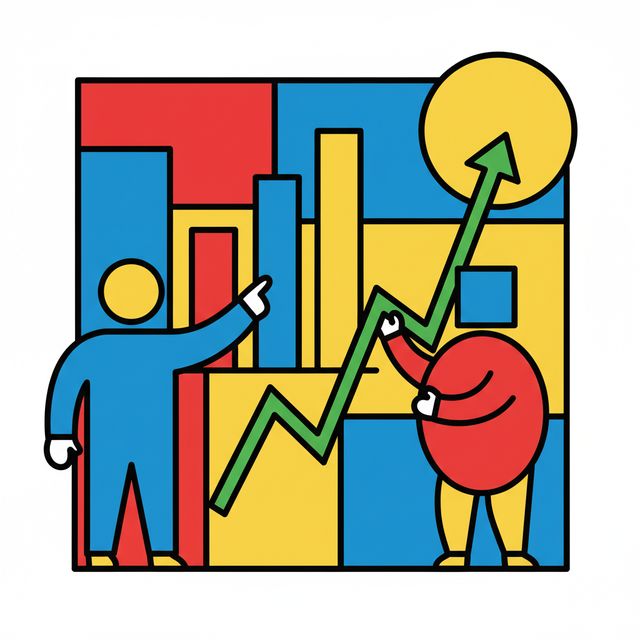
Charts are powerful tools for transforming raw data into understandable and actionable insights. At a high level, a chart is a graphical representation of data, where information is symbolized by elements like bars in a bar chart, lines in a line chart, or slices in a pie chart. They serve as a visual language, making complex datasets accessible and revealing patterns, trends, and comparisons that might be obscured in text or tables. Understanding charts is not just for data specialists; it's a valuable skill in countless fields.
n1hmnl|
Find a path to becoming a Charts. Learn more at:
OpenCourser.com/topic/n1hmnl/chart
Reading list
We've selected 11 books
that we think will supplement your
learning. Use these to
develop background knowledge, enrich your coursework, and gain a
deeper understanding of the topics covered in
Charts.
Introduces the grammar of graphics, a conceptual framework for understanding and creating data visualizations. It foundational work in the field of data visualization, and it is essential reading for anyone who wants to understand the principles of effective chart design.
Comprehensive treatise on the principles of data visualization. It covers a wide range of topics, from the design of individual charts to the creation of effective data visualization presentations. It must-read for anyone who wants to understand the theory and practice of data visualization at a deep level.
By Stephen Few, another pioneer in the field of data visualization, provides practical guidance on how to choose the right chart type for different types of data and messages. It is an essential resource for anyone who wants to create effective data visualizations.
By Hans Rosling, a renowned data visualization expert, focuses on the visualization of time-series data. It provides practical guidance on how to create charts that effectively convey trends and patterns over time.
Introduces the ggplot2 package in R, a powerful tool for creating sophisticated and visually appealing charts. It must-have resource for data scientists and analysts who use R.
Provides a comprehensive overview of the principles of information graphics. It covers a wide range of topics, from the history of information graphics to the use of color and typography in data visualization. It good resource for anyone who wants to learn more about the theory and practice of information graphics.
Provides a comprehensive introduction to the Plotly graphing library in Python, covering everything from basic chart types to advanced interactive features. It is an excellent resource for data scientists, analysts, and anyone who wants to create beautiful and informative charts.
Introduces data visualization using Python and JavaScript, covering a wide range of chart types and techniques. It practical guide for anyone who wants to learn how to create effective data visualizations.
Provides a practical guide to data visualization. It covers a wide range of chart types and techniques, and it includes many real-world examples. It good resource for anyone who wants to learn how to create effective data visualizations quickly and easily.
Introduces Tableau, a popular data visualization software package. It covers a wide range of chart types and techniques, and it good resource for anyone who wants to learn how to create effective data visualizations in Tableau.
Provides a gentle introduction to data visualization for beginners. It covers a wide range of chart types and techniques, and it is written in a clear and accessible style.
For more information about how these books relate to this course, visit:
OpenCourser.com/topic/n1hmnl/chart